
Page 4 - 4. TFPA export to World in January-April 2021
P. 4
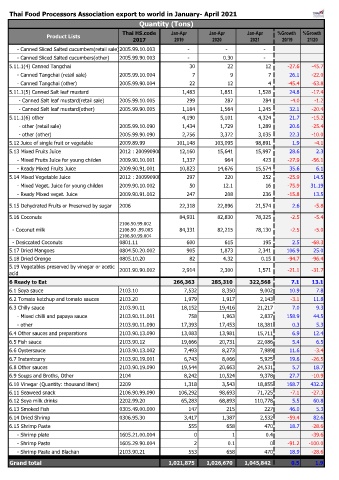
Thai Food Processors Association export to world in January- April 2021
                                                  Quantity (Tons)
                                            Thai HS.code     Jan-Apr      Jan-Apr       Jan-Apr   %Growth   %Growth
                 Product Lists
                                                2017          2019          2020         2021       20/19    21/20
         - Canned Sliced Salted cucumbers(retail sale)2005.99.10.003                   -                   -                   -
         - Canned Sliced Salted cucumbers(other)  2005.99.90.003                   -                  0.30                   -
    5.11.1(4) Canned Tangchai                                                30                     22                     12  -27.6  -45.7
         - Canned Tangchai (retail sale)   2005.99.10.004                      7                      9                      7  26.1  -22.0
         - Canned Tangchai (other)         2005.99.90.004                     22                     12                      4  -45.4  -63.8
    5.11.1(5) Canned Salt leaf mustard                                  1,483                1,851                1,528  24.8  -17.4
          - Canned Salt leaf mustard(retail sale)  2005.99.10.005                   299                   287                   284  -4.0  -1.2
          - Canned Salt leaf mustard(other)  2005.99.90.005                1,184                1,564                1,245  32.1  -20.4
    5.11.1(6) other                                                     4,190                5,101                4,324  21.7  -15.2
          - other (retail sale)            2005.99.10.090                1,434                1,729                1,289  20.6  -25.4
          - other (other)                  2005.99.90.090                2,756                3,372                3,035  22.3  -10.0
    5.12 Juice of single fruit or vegetable  2009.89.99              101,148            103,095              98,891  1.9  -4.1
    5.13 Mixed Fruits Juice                2012 : 20099090001            12,160              15,641              15,997  28.6  2.3
         - Mixed Fruits Juice for young childen  2009.90.10.001                1,337                   964                   423  -27.9  -56.1
         - Ready Mixed Fruits Juice        2009.90.91.001              10,823              14,676              15,574  35.6  6.1
    5.14 Mixed Vegetable Juice             2012 : 20099090002                 297                   220                   252  -25.9  14.5
         - Mixed Veget. Juice for young childen  2009.90.10.002                     50                  12.1                     16  -75.9  31.19
         - Ready Mixed veget. Juice        2009.90.91.002                   247                   208                   236  -15.8  13.5
    5.15 Dehydrated Fruits or Preserved by sugar  2006                 22,318              22,896              21,574  2.6  -5.8

    5.16 Coconuts                                                      84,931              82,830              78,325  -2.5  -5.4
                                           2106.90.99.002
      - Coconut milk                       2106.90 .99.003              84,331              82,215              78,130  -2.5  -5.0
                                           2106.90.99.004
      - Desiccated Coconuts                0801.11                         600                   615                   195  2.5  -68.3
    5.17 Dried Mangoes                     0804.50.20.002                   905                1,873                2,341  106.9  25.0
    5.18 Dried Orenge                      0805.10.20                        82                  4.32                  0.15  -94.7  -96.4
    5.19 Vegetables preserved by vinegar or acetic   2001.90.90.002                2,914                2,300                1,571  -21.1  -31.7
    acid
                                                                                                    #DIV/0!  #DIV/0!
    6 Ready to Eat                                                 266,363          285,310          322,568  7.1  13.1
    6.1 Soya sauce                         2103.10                7,532        8,350        9,002      10.9     7.8
    6.2 Tomato ketchup and tomato sauces   2103.20                1,979        1,917        2,143      -3.1    11.8
    6.3 Chilly sauce                       2103.90.11            18,152       19,416       21,217       7.0     9.3
         - Mixed chilli and papaya sauce   2103.90.11.001          758         1,963        2,837     158.9    44.5
         - other                           2103.90.11.090        17,393       17,453       18,381       0.3     5.3
    6.4 Other sauces and preparations      2103.90.13.090        13,083       13,981       15,711       6.9    12.4
    6.5 Fish sauce                         2103.90.12            19,666       20,731       22,086       5.4     6.5
    6.6 Oystersauce                        2103.90.13.002         7,493        8,273        7,989      11.6    -3.4
    6.7 Instantcurry                       2103.90.19.001         6,743        8,066        5,925      19.6   -26.5
    6.8 Other sauces                       2103.90.19.090        19,544       20,663       24,531       5.7    18.7
    6.9 Soups and Broths, Other            2104                   8,242       10,524        9,378      27.7   -10.9
    6.10 Vinegar (Quantity: thousand liters)  2209                1,318        3,543       18,855     168.7   432.2
    6.11 Seaweed snack                     2106.90.99.090       106,292       98,693       71,725      -7.1   -27.3
    6.12 Soya milk drinks                  2202.99.20            65,283       68,893      110,778       5.5    60.8
    6.13 Smoked Fish                       0305.49.00.000          147           215          227      46.0     5.3
    6.14 Dried Shrimp                      0306.95.30             3,417        1,387        2,532     -59.4    82.6
    6.15 Shrimp Paste                                              555           658          470      18.7   -28.6
         - Shrimp plate                    1605.21.00.004            0             1          0.4             -39.6
         - Shrimp Paste                    1605.29.90.004            2           0.1            0     -91.2  -100.0
         - Shrimp Paste and Blachan        2103.90.21              553           658          470      18.9   -28.6

    Grand total                                                 1,021,875       1,026,670       1,045,842  0.5  1.9