
Page 2 - 4. TFPA export to World in January-April 2021
P. 2
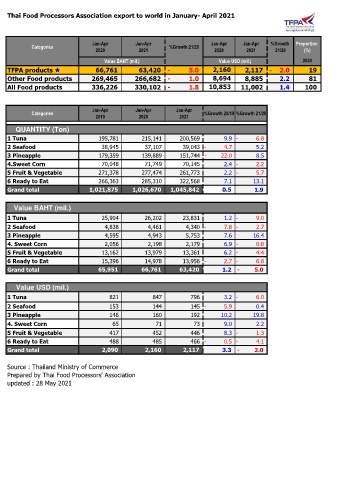
Thai Food Processors Association export to world in January- April 2021
Jan-Apr Jan-Apr Jan-Apr Jan-Apr %Growth Proportion
Categories %Growth 21/20
2020 2021 2020 2021 21/20 (%)
Value BAHT (mil.) Value USD (mil.) 2020
TFPA products 66,761 63,420 - 5.0 2,160 2,117 - 2.0 19
Other Food products 269,465 266,682 - 1.0 8,694 8,885 2.2 81
All Food products 336,226 330,102 - 1.8 10,853 11,002 1.4 100
Jan-Apr Jan-Apr Jan-Apr
Categories %Growth 20/19 %Growth 21/20
2019 2020 2021
QUANTITY (Ton)
1 Tuna 195,781 215,141 200,569 9.9 - 6.8
2 Seafood 38,945 37,107 39,043 - 4.7 5.2
3 Pineapple 179,359 139,889 151,744 - 22.0 8.5
4.Sweet Corn 70,048 71,749 70,145 2.4 - 2.2
5 Fruit & Vegetable 271,378 277,474 261,773 2.2 - 5.7
6 Ready to Eat 266,363 285,310 322,568 7.1 13.1
Grand total 1,021,875 1,026,670 1,045,842 0.5 1.9
Value BAHT (mil.)
1 Tuna 25,904 26,202 23,831 1.2 - 9.0
2 Seafood 4,838 4,461 4,340 - 7.8 - 2.7
3 Pineapple 4,595 4,943 5,753 7.6 16.4
4. Sweet Corn 2,056 2,198 2,179 6.9 - 0.8
5 Fruit & Vegetable 13,162 13,979 13,361 6.2 - 4.4
6 Ready to Eat 15,396 14,978 13,956 - 2.7 - 6.8
Grand total 65,951 66,761 63,420 1.2 - 5.0
Value USD (mil.)
1 Tuna 821 847 796 3.2 - 6.0
2 Seafood 153 144 145 - 5.9 0.4
3 Pineapple 146 160 192 10.2 19.8
4. Sweet Corn 65 71 73 9.0 2.2
5 Fruit & Vegetable 417 452 446 8.3 - 1.3
6 Ready to Eat 488 485 466 - 0.5 - 4.1
Grand total 2,090 2,160 2,117 3.3 - 2.0
Source : Thailand Ministry of Commerce
Prepared by Thai Food Processors' Association
updated : 28 May 2021