
Page 3 - 4. TFPA export to World in January-April 2021
P. 3
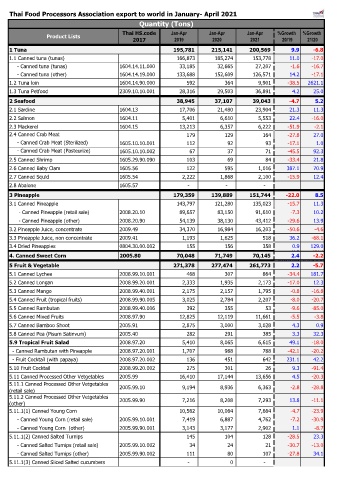
Thai Food Processors Association export to world in January- April 2021
                                                  Quantity (Tons)
                                            Thai HS.code     Jan-Apr      Jan-Apr       Jan-Apr   %Growth   %Growth
                 Product Lists
                                                2017          2019          2020         2021       20/19    21/20
    1 Tuna                                                         195,781          215,141          200,569  9.9  -6.8
    1.1 Canned tuna (tunas)                                          166,873            185,274            153,778  11.0  -17.0
         - Canned tuna (tunas)             1604.14.11.000              33,185              32,665              27,207  -1.6  -16.7
         - Canned tuna (other)             1604.14.19.000            133,688            152,609            126,571  14.2  -17.1
    1.2 Tuna loin                          1604.14.90.000                   592                   364                9,901  -38.5  2621.1
    1.3 Tuna Petfood                       2309.10.10.001              28,316              29,503              36,891  4.2  25.0
                                                                                                    #DIV/0!  #DIV/0!
    2 Seafood                                                        38,945             37,107             39,043  -4.7  5.2
    2.1 Sardine                            1604.13                     17,706              21,480              23,904  21.3  11.3
    2.2 Salmon                             1604.11                      5,401                6,610                5,553  22.4  -16.0
    2.3 Mackerel                           1604.15                     13,213                6,357                6,222  -51.9  -2.1
    2.4 Canned Crab Meat                                                   179                   129                   164  -27.8  27.0
         - Canned Crab Meat (Sterilized)   1605.10.10.001                   112                     92                     93  -17.1  1.0
         - Canned Crab Meat (Pasteurize)   1605.10.10.002                     67                     37                     71  -45.5  92.3
    2.5 Canned Shrimp                      1605.29.90.090                   103                     69                     84  -33.4  21.8
    2.6 Canned Baby Clam                   1605.56                         122                   595                1,016  387.1  70.9
    2.7 Canned Squid                       1605.54                      2,222                1,868                2,100  -15.9  12.4
    2.8 Abalone                            1605.57                          -                   -                   -
                                                                                                    #DIV/0!  #DIV/0!
    3 Pineapple                                                    179,359          139,889          151,744  -22.0  8.5
    3.1 Canned Pineapple                                             143,797            121,280            135,023  -15.7  11.3
          - Canned Pineapple (retail sale)  2008.20.10                 89,657              83,150              91,610  -7.3  10.2
          - Canned Pineapple (other)       2008.20.90                  54,139              38,130              43,412  -29.6  13.9
    3.2 Pineapple Juice, concentrate       2009.49                     34,370              16,984              16,203  -50.6  -4.6
    3.3 Pineapple Juice, non concentrate   2009.41                      1,193                1,625                   518  36.2  -68.1
    3.4 Dried Pineapples                   0804.30.00.002                   155                   156                   358  0.9  129.0
                                                                       54,739              55,171                   144  0.8  -99.7
    4. Canned Sweet Corn                   2005.80                   70,048             71,749             70,145  2.4  -2.2
                                                                                                  #DIV/0! #####
    5 Fruit & Vegetable                                            271,378          277,474          261,773  2.2  -5.7
    5.1 Canned Lychee                      2008.99.10.001                   468                   307                   864  -34.4  181.7
    5.2 Canned Longan                      2008.99.20.001                2,333                1,935                2,173  -17.0  12.3
    5.3 Canned Mango                       2008.99.40.001                 2,175                2,157                1,795  -0.8  -16.8
    5.4 Canned Fruit (tropical fruits)     2008.99.90.005                3,025                2,784                2,207  -8.0  -20.7
    5.5 Canned Rambutan                    2008.99.40.006                   392                   355                     53  -9.6  -85.0
    5.6 Canned Mixed Fruits                2008.97.90                  12,825              12,119              11,661  -5.5  -3.8
    5.7 Canned Bamboo Shoot                2005.91                      2,875                3,000                3,028  4.3  0.9
    5.8 Canned Pea (Pisum Satinvum)        2005.40                         282                   291                   385  3.3  32.3
    5.9 Tropical Fruit Salad               2008.97.20                   5,410                8,065                6,615  49.1  -18.0
      - Canned Rambutan with Pineapple     2008.97.20.001                1,707                   988                   788  -42.1  -20.2
      - Fruit Cocktail (with papaya)       2008.97.20.002                   136                   451                   642  231.1  42.2
    5.10 Fruit Cocktail                    2008.99.20.002                   275                   301                     26  9.3  -91.4
    5.11 Canned Processed Other Vetgetables  2005.99                   16,410              17,144              13,656  4.5  -20.3
    5.11.1 Canned Processed Other Vetgetables   2005.99.10                9,194                8,936                6,363  -2.8  -28.8
    (retail sale)
    5.11.2 Canned Processed Other Vetgetables   2005.99.90                7,216                8,208                7,293  13.8  -11.1
    (other)
    5.11.1(1) Canned Young Corn                                        10,562              10,064                7,664  -4.7  -23.9
         - Canned Young Corn (retail sale)  2005.99.10.001                7,419                6,887                4,762  -7.2  -30.9
         - Canned Young Corn  (other)      2005.99.90.001                3,143                3,177                2,902  1.1  -8.7
    5.11.1(2) Canned Salted Turnips                                        145                   104                   128  -28.5  23.3
         - Canned Salted Turnips (retail sale)  2005.99.10.002                     34                     24                     21  -30.7  -13.0
         - Canned Salted Turnips (other)   2005.99.90.002                   111                     80                   107  -27.8  34.1
    5.11.1(3) Canned Sliced Salted cucumbers                                -                      0                   -