
Page 6 - 3. TFPA Export to World in January-March 2021
P. 6
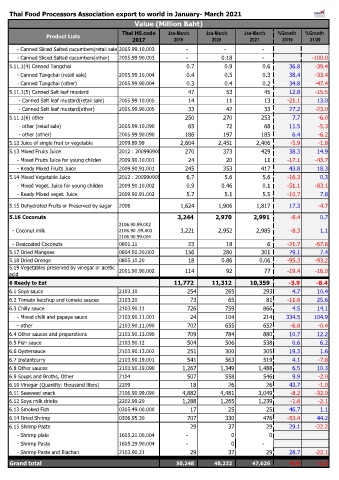
Thai Food Processors Association export to world in January- March 2021
                                                Value (Million Baht)
                                            Thai HS.code    Jan-March    Jan-March     Jan-March   %Growth   %Growth
                 Product Lists
                                               2017           2019         2020          2021       20/19     21/20
         - Canned Sliced Salted cucumbers(retail sale)2005.99.10.003                 -                 -                 -
         - Canned Sliced Salted cucumbers(other)  2005.99.90.003                 -               0.18                 -  -100.0
    5.11.1(4) Canned Tangchai                                            0.7                 0.9                 0.6  36.8  -39.4
         - Canned Tangchai (retail sale)   2005.99.10.004                 0.4                 0.5                 0.3  38.4  -33.4
         - Canned Tangchai (other)         2005.99.90.004                 0.3                 0.4                 0.2  34.8  -47.4
    5.11.1(5) Canned Salt leaf mustard                                    47                  53                  45  12.8  -15.5
          - Canned Salt leaf mustard(retail sale)  2005.99.10.005                  14                  11                  13  -21.1  13.0
          - Canned Salt leaf mustard(other)  2005.99.90.005                  33                  42                  33  27.2  -23.0
    5.11.1(6) other                                                      250                270                253  7.7  -6.0
          - other (retail sale)            2005.99.10.090                  65                  72                  68  11.5  -5.3
          - other (other)                  2005.99.90.090                186                197                185  6.4  -6.2
    5.12 Juice of single fruit or vegetable  2009.89.99               2,604              2,451              2,406  -5.9  -1.8
    5.13 Mixed Fruits Juice                2012 : 20099090001               270                373                429  38.3  14.9
         - Mixed Fruits Juice for young childen  2009.90.10.001                  24                  20                  11  -17.1  -43.7
         - Ready Mixed Fruits Juice        2009.90.91.001                245                353                417  43.8  18.3
    5.14 Mixed Vegetable Juice             2012 : 20099090002                6.7                 5.6                 5.6  -16.3  0.3
         - Mixed Veget. Juice for young childen  2009.90.10.002                 0.9               0.46                 0.1  -51.1  -83.1
         - Ready Mixed veget. Juice        2009.90.91.002                 5.7                 5.1                 5.5  -10.7  7.8
    5.15 Dehydrated Fruits or Preserved by sugar  2006                1,624              1,906              1,817  17.3  -4.7

    5.16 Coconuts                                                    3,244            2,970            2,991  -8.4  0.7
                                           2106.90.99.002
      - Coconut milk                       2106.90 .99.003              3,221              2,952              2,985  -8.3  1.1
                                           2106.90.99.004
      - Desiccated Coconuts                0801.11                        23                  18                    6  -21.7  -67.8
    5.17 Dried Mangoes                     0804.50.20.002                156                280                301  79.1  7.4
    5.18 Dried Orenge                      0805.10.20                     18               0.86               0.06  -95.3  -93.2
    5.19 Vegetables preserved by vinegar or acetic   2001.90.90.002
                                                                                                      -19.4
                                                                                                                -16.0
    acid                                                                 114                  92                  77  #DIV/0!  #DIV/0!
    6 Ready to Eat                                                 11,772          11,312          10,359  -3.9  -8.4
    6.1 Soya sauce                         2103.10                 254          265          293        4.7     10.4
    6.2 Tomato ketchup and tomato sauces   2103.20                  73           65            81     -11.8     25.6
    6.3 Chilly sauce                       2103.90.11              726          759          866        4.5     14.1
         - Mixed chilli and papaya sauce   2103.90.11.001           24          104          214      334.5    104.9
         - other                           2103.90.11.090          702          655          652       -6.8      -0.4
    6.4 Other sauces and preparations      2103.90.13.090          709          784          880       10.7     12.2
    6.5 Fish sauce                         2103.90.12              504          506          538        0.6      6.2
    6.6 Oystersauce                        2103.90.13.002          251          300          305       19.3      1.6
    6.7 Instantcurry                       2103.90.19.001          541          563          519        4.1      -7.8
    6.8 Other sauces                       2103.90.19.090        1,267        1,349         1,488       6.5     10.3
    6.9 Soups and Broths, Other            2104                    507          558          546        9.9      -2.0
    6.10 Vinegar (Quantity: thousand liters)  2209                  18           26            26      43.7      -1.0
    6.11 Seaweed snack                     2106.90.99.090        4,882        4,481         3,049      -8.2     -32.0
    6.12 Soya milk drinks                  2202.99.20            1,288        1,265         1,239      -1.8      -2.1
    6.13 Smoked Fish                       0305.49.00.000           17           25            25      46.7      1.1
    6.14 Dried Shrimp                      0306.95.30              707          330          476      -53.4     44.2
    6.15 Shrimp Paste                                               29           37            29      29.1     -22.2
         - Shrimp plate                    1605.21.00.004                 -       0             0
         - Shrimp Paste                    1605.29.90.004                 -       0                -
         - Shrimp Paste and Blachan        2103.90.21               29           37            29      28.7     -22.1

    Grand total                                                      50,248             48,232             47,626  -4.0  -1.3