
Page 4 - 3. TFPA Export to World in January-March 2021
P. 4
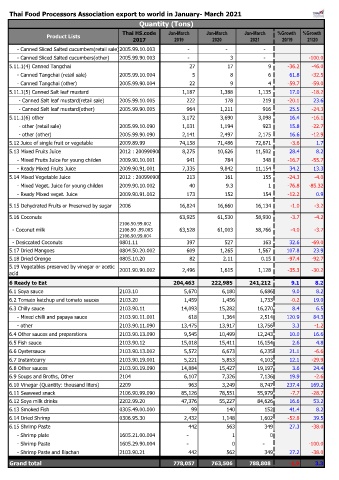
Thai Food Processors Association export to world in January- March 2021
                                                  Quantity (Tons)
                                            Thai HS.code    Jan-March     Jan-March    Jan-March  %Growth   %Growth
                 Product Lists
                                                2017          2019          2020         2021       20/19    21/20
         - Canned Sliced Salted cucumbers(retail sale)2005.99.10.003                   -                   -                   -
         - Canned Sliced Salted cucumbers(other)  2005.99.90.003                   -                      3                   -  -100.0
    5.11.1(4) Canned Tangchai                                                27                     17                      9  -36.2  -46.0
         - Canned Tangchai (retail sale)   2005.99.10.004                      5                      8                      6  61.8  -32.5
         - Canned Tangchai (other)         2005.99.90.004                     22                      9                      4  -59.7  -59.0
    5.11.1(5) Canned Salt leaf mustard                                  1,187                1,388                1,135  17.0  -18.2
          - Canned Salt leaf mustard(retail sale)  2005.99.10.005                   222                   178                   219  -20.1  23.6
          - Canned Salt leaf mustard(other)  2005.99.90.005                   964                1,211                   916  25.5  -24.3
    5.11.1(6) other                                                     3,172                3,690                3,098  16.4  -16.1
          - other (retail sale)            2005.99.10.090                1,031                1,194                   923  15.8  -22.7
          - other (other)                  2005.99.90.090                2,141                2,497                2,175  16.6  -12.9
    5.12 Juice of single fruit or vegetable  2009.89.99                74,158              71,486              72,671  -3.6  1.7
    5.13 Mixed Fruits Juice                2012 : 20099090001              8,275              10,626              11,502  28.4  8.2
         - Mixed Fruits Juice for young childen  2009.90.10.001                   941                   784                   348  -16.7  -55.7
         - Ready Mixed Fruits Juice        2009.90.91.001                7,335                9,842              11,154  34.2  13.3
    5.14 Mixed Vegetable Juice             2012 : 20099090002                 213                   161                   155  -24.3  -4.0
         - Mixed Veget. Juice for young childen  2009.90.10.002                     40                    9.3                      1  -76.8  -85.32
         - Ready Mixed veget. Juice        2009.90.91.002                   173                   152                   154  -12.2  0.9
    5.15 Dehydrated Fruits or Preserved by sugar  2006                 16,824              16,660              16,134  -1.0  -3.2

    5.16 Coconuts                                                      63,925              61,530              58,930  -3.7  -4.2
                                           2106.90.99.002
      - Coconut milk                       2106.90 .99.003              63,528              61,003              58,766  -4.0  -3.7
                                           2106.90.99.004
      - Desiccated Coconuts                0801.11                         397                   527                   163  32.6  -69.0
    5.17 Dried Mangoes                     0804.50.20.002                   609                1,265                1,567  107.8  23.9
    5.18 Dried Orenge                      0805.10.20                        82                  2.11                  0.15  -97.4  -92.7
    5.19 Vegetables preserved by vinegar or acetic   2001.90.90.002                2,496                1,615                1,128  -35.3  -30.2
    acid
                                                                                                    #DIV/0!  #DIV/0!
    6 Ready to Eat                                                 204,463          222,985          241,212  9.1  8.2
    6.1 Soya sauce                         2103.10                5,670        6,180        6,686       9.0     8.2
    6.2 Tomato ketchup and tomato sauces   2103.20                1,459        1,456        1,733      -0.2    19.0
    6.3 Chilly sauce                       2103.90.11            14,093       15,282       16,270       8.4     6.5
         - Mixed chilli and papaya sauce   2103.90.11.001          618         1,364        2,514     120.9    84.3
         - other                           2103.90.11.090        13,475       13,917       13,756       3.3    -1.2
    6.4 Other sauces and preparations      2103.90.13.090         9,545       10,499       12,243      10.0    16.6
    6.5 Fish sauce                         2103.90.12            15,018       15,411       16,154       2.6     4.8
    6.6 Oystersauce                        2103.90.13.002         5,572        6,673        6,235      21.1    -6.6
    6.7 Instantcurry                       2103.90.19.001         5,221        5,853        4,103      12.1   -29.9
    6.8 Other sauces                       2103.90.19.090        14,884       15,427       19,197       3.6    24.4
    6.9 Soups and Broths, Other            2104                   6,107        7,326        7,136      19.9    -2.6
    6.10 Vinegar (Quantity: thousand liters)  2209                 963         3,249        8,747     237.4   169.2
    6.11 Seaweed snack                     2106.90.99.090        85,126       78,551       55,979      -7.7   -28.7
    6.12 Soya milk drinks                  2202.99.20            47,376       55,227       84,626      16.6    53.2
    6.13 Smoked Fish                       0305.49.00.000           99           140          152      41.4     8.2
    6.14 Dried Shrimp                      0306.95.30             2,432        1,148        1,602     -52.8    39.5
    6.15 Shrimp Paste                                              442           563          349      27.3   -38.0
         - Shrimp plate                    1605.21.00.004                 -        1            0
         - Shrimp Paste                    1605.29.90.004                 -        0                -        -100.0
         - Shrimp Paste and Blachan        2103.90.21              442           562          349      27.2   -38.0

    Grand total                                                    778,057          763,506          788,808  -1.9  3.3