
Page 2 - 3. TFPA Export to World in January-March 2021
P. 2
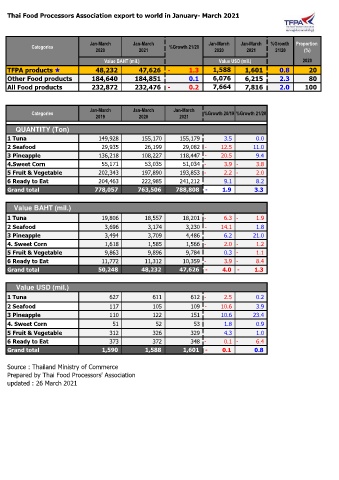
Thai Food Processors Association export to world in January- March 2021
Jan-March Jan-March Jan-March Jan-March %Growth Proportion
Categories %Growth 21/20
2020 2021 2020 2021 21/20 (%)
Value BAHT (mil.) Value USD (mil.) 2020
TFPA products 48,232 47,626 - 1.3 1,588 1,601 0.8 20
Other Food products 184,640 184,851 0.1 6,076 6,215 2.3 80
All Food products 232,872 232,476 - 0.2 7,664 7,816 2.0 100
Jan-March Jan-March Jan-March
Categories %Growth 20/19 %Growth 21/20
2019 2020 2021
QUANTITY (Ton)
1 Tuna 149,928 155,170 155,179 3.5 0.0
2 Seafood 29,935 26,199 29,082 - 12.5 11.0
3 Pineapple 136,218 108,227 118,447 - 20.5 9.4
4.Sweet Corn 55,171 53,035 51,034 - 3.9 - 3.8
5 Fruit & Vegetable 202,343 197,890 193,853 - 2.2 - 2.0
6 Ready to Eat 204,463 222,985 241,212 9.1 8.2
Grand total 778,057 763,506 788,808 - 1.9 3.3
Value BAHT (mil.)
1 Tuna 19,806 18,557 18,201 - 6.3 - 1.9
2 Seafood 3,696 3,174 3,230 - 14.1 1.8
3 Pineapple 3,494 3,709 4,486 6.2 21.0
4. Sweet Corn 1,618 1,585 1,566 - 2.0 - 1.2
5 Fruit & Vegetable 9,863 9,896 9,784 0.3 - 1.1
6 Ready to Eat 11,772 11,312 10,359 - 3.9 - 8.4
Grand total 50,248 48,232 47,626 - 4.0 - 1.3
Value USD (mil.)
1 Tuna 627 611 612 - 2.5 0.2
2 Seafood 117 105 109 - 10.6 3.9
3 Pineapple 110 122 151 10.6 23.4
4. Sweet Corn 51 52 53 1.8 0.9
5 Fruit & Vegetable 312 326 329 4.3 1.0
6 Ready to Eat 373 372 348 - 0.1 - 6.4
Grand total 1,590 1,588 1,601 - 0.1 0.8
Source : Thailand Ministry of Commerce
Prepared by Thai Food Processors' Association
updated : 26 March 2021