Page 3 - 2.TFPA export to World in January-Febuary 2021
P. 3

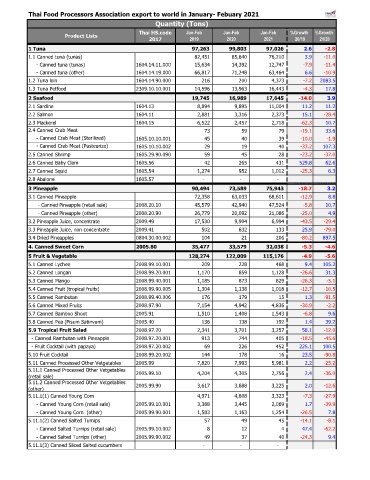
Thai Food Processors Association export to world in January- Febuary 2021
                                                         Quantity (Tons)

                                                   Thai HS.code     Jan-Feb      Jan-Feb       Jan-Feb   %Growth   %Growth
                        Product Lists
                                                       2017          2019          2020         2021       20/19    21/20
           1 Tuna                                                           97,263             99,803             97,026  2.6  -2.8
           1.1 Canned tuna (tunas)                                           82,451              85,640              76,210  3.9  -11.0
                - Canned tuna (tunas)             1604.14.11.000              15,634              14,392              12,747  -7.9  -11.4
                - Canned tuna (other)             1604.14.19.000              66,817              71,248              63,464  6.6  -10.9
           1.2 Tuna loin                          1604.14.90.000                  216                  200               4,373  -7.2  2083.5
           1.3 Tuna Petfood                       2309.10.10.001              14,596              13,963              16,443  -4.3  17.8
                                                                                                           #DIV/0!  #DIV/0!
           2 Seafood                                                        19,745             16,989             17,645  -14.0  3.9
           2.1 Sardine                            1604.13                      8,894               9,895              11,004  11.2  11.2
           2.2 Salmon                             1604.11                      2,881               3,316               2,373  15.1  -28.4
           2.3 Mackerel                           1604.15                      6,522               2,457               2,718  -62.3  10.7
           2.4 Canned Crab Meat                                                    73                    59                    79  -19.1  33.6
                - Canned Crab Meat (Sterilized)   1605.10.10.001                    45                    40                    39  -10.0  -1.9
                - Canned Crab Meat (Pasteurize)   1605.10.10.002                    29                    19                    40  -33.2  107.3
           2.5 Canned Shrimp                      1605.29.90.090                    59                    45                    28  -23.2  -37.0
           2.6 Canned Baby Clam                   1605.56                          42                  265                  431  529.8  62.6
           2.7 Canned Squid                       1605.54                      1,274                  952               1,012  -25.3  6.3
           2.8 Abalone                            1605.57                         -                   -                   -
                                                                                                           #DIV/0!  #DIV/0!
           3 Pineapple                                                      90,494             73,589             75,943  -18.7  3.2
           3.1 Canned Pineapple                                              72,358              63,033              68,611  -12.9  8.8
                 - Canned Pineapple (retail sale)  2008.20.10                45,579              42,940              47,524  -5.8  10.7
                 - Canned Pineapple (other)       2008.20.90                 26,779              20,092              21,086  -25.0  4.9
           3.2 Pineapple Juice, concentrate       2009.49                    17,530               9,904               6,994  -43.5  -29.4
           3.3 Pineapple Juice, non concentrate   2009.41                        502                  632                  133  25.9  -79.0
           3.4 Dried Pineapples                   0804.30.00.002                  104                    21                  206  -80.2  897.5
                                                                             54,739              55,171                  144  0.8  -99.7
           4. Canned Sweet Corn                   2005.80                   35,477             33,579             32,038  -5.3  -4.6
                                                                                                         #DIV/0! #####
           5 Fruit & Vegetable                                            128,274          122,009          115,176  -4.9  -5.6
           5.1 Canned Lychee                      2008.99.10.001                  209                  228                  468  9.4  105.2
           5.2 Canned Longan                      2008.99.20.001               1,170                  859               1,128  -26.6  31.3
           5.3 Canned Mango                       2008.99.40.001                1,185                  873                  829  -26.3  -5.1
           5.4 Canned Fruit (tropical fruits)     2008.99.90.005               1,304               1,138               1,018  -12.7  -10.5
           5.5 Canned Rambutan                    2008.99.40.006                  176                  179                    15  1.3  -91.5
           5.6 Canned Mixed Fruits                2008.97.90                   7,154               4,942               4,836  -30.9  -2.2
           5.7 Canned Bamboo Shoot                2005.91                      1,510               1,408               1,543  -6.8  9.6
           5.8 Canned Pea (Pisum Satinvum)        2005.40                        136                  138                  192  1.4  39.2
           5.9 Tropical Fruit Salad               2008.97.20                   2,341               3,701               3,257  58.1  -12.0
             - Canned Rambutan with Pineapple     2008.97.20.001                  913                  744                  405  -18.5  -45.6
             - Fruit Cocktail (with papaya)       2008.97.20.002                    69                  226                  452  225.1  100.5
           5.10 Fruit Cocktail                    2008.99.20.002                  144                  178                    16  23.5  -90.8
           5.11 Canned Processed Other Vetgetables  2005.99                    7,820               7,993               5,981  2.2  -25.2
           5.11.1 Canned Processed Other Vetgetables   2005.99.10               4,204               4,305               2,756  2.4  -36.0
           (retail sale)
           5.11.2 Canned Processed Other Vetgetables   2005.99.90               3,617               3,688               3,225  2.0  -12.6
           (other)
           5.11.1(1) Canned Young Corn                                         4,971               4,608               3,323  -7.3  -27.9
                - Canned Young Corn (retail sale)  2005.99.10.001               3,388               3,445               2,069  1.7  -39.9
                - Canned Young Corn  (other)      2005.99.90.001               1,583               1,163               1,254  -26.5  7.8
           5.11.1(2) Canned Salted Turnips                                         57                    49                    45  -14.1  -8.1
                - Canned Salted Turnips (retail sale)  2005.99.10.002                      8                    12                      4  47.4  -62.2
                - Canned Salted Turnips (other)   2005.99.90.002                    49                    37                    40  -24.3  9.4
           5.11.1(3) Canned Sliced Salted cucumbers                               -                   -                   -
   1   2   3   4   5   6   7   8