Page 2 - 1. TFPA export to World in January - January 2021 update
P. 2

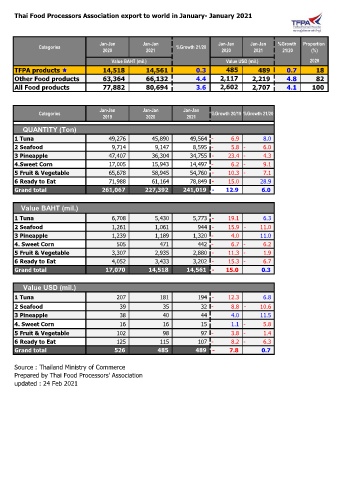
Thai Food Processors Association export to world in January- January 2021


                                    Jan-Jan        Jan-Jan                    Jan-Jan    Jan-Jan   %Growth   Proportion
               Categories                                      %Growth 21/20
                                     2020           2021                       2020       2021      21/20     (%)
                                        Value BAHT (mil.)                       Value USD (mil.)              2020
      TFPA products                      14,518           14,561              0.3          485          489        0.7          18
      Other Food products                 63,364           66,132              4.4       2,117       2,219        4.8          82
      All Food products                   77,882           80,694              3.6       2,602       2,707        4.1       100


                                    Jan-Jan        Jan-Jan       Jan-Jan
               Categories                                                  %Growth 20/19 %Growth 21/20
                                     2019           2020           2021
         QUANTITY (Ton)
      1 Tuna                                 49,276               45,890            49,564 -            6.9              8.0
      2 Seafood                               9,714                9,147               8,595 -            5.8 -            6.0
      3 Pineapple                            47,407               36,304            34,755 -          23.4 -            4.3
      4.Sweet Corn                           17,005               15,943            14,497 -            6.2 -            9.1
      5 Fruit & Vegetable                    65,678               58,945            54,760 -          10.3 -            7.1
      6 Ready to Eat                         71,988               61,164            78,849 -          15.0            28.9
      Grand total                        261,067           227,392        241,019 -         12.9             6.0


        Value BAHT (mil.)
      1 Tuna                                  6,708                5,430               5,773 -          19.1              6.3
      2 Seafood                               1,261                1,061                944 -          15.9 -          11.0

      3 Pineapple                             1,239                1,189             1,320 -            4.0            11.0
      4. Sweet Corn                              505                   471                442 -            6.7 -            6.2
      5 Fruit & Vegetable                     3,307                2,935               2,880 -          11.3 -            1.9

      6 Ready to Eat                          4,052                3,433             3,202 -          15.3 -            6.7
      Grand total                          17,070             14,518          14,561 -         15.0             0.3


         Value USD (mil.)
      1 Tuna                                     207                   181                194 -          12.3              6.8
      2 Seafood                                    39                     35                  32 -            8.8 -          10.6
      3 Pineapple                                  38                     40                  44              4.0            11.5
      4. Sweet Corn                                16                     16                  15              1.1 -            5.8
      5 Fruit & Vegetable                        102                     98                  97 -            3.8 -            1.4
      6 Ready to Eat                             125                   115                107 -            8.2 -            6.3
      Grand total                                526                   485                489  -           7.8             0.7


      Source : Thailand Ministry of Commerce
      Prepared by Thai Food Processors' Association
      updated : 24 Feb 2021
   1   2   3   4   5   6   7