
Page 5 - 8. TFPA export to World in January-August 2021
P. 5
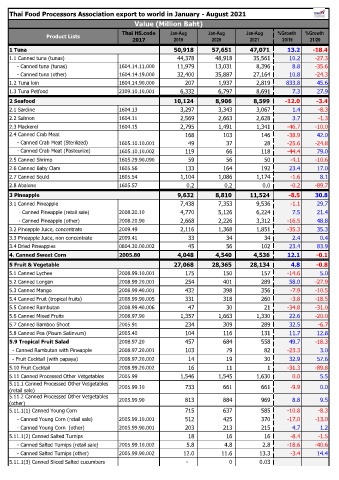
Thai Food Processors Association export to world in January - August 2021
                                                Value (Million Baht)
                                            Thai HS.code     Jan-Aug      Jan-Aug      Jan-Aug     %Growth   %Growth
                 Product Lists
                                               2017           2019         2020          2021       20/19     21/20
    1 Tuna                                                         50,918          57,651          47,071  13.2  -18.4
    1.1 Canned tuna (tunas)                                         44,378            48,918            35,561  10.2  -27.3
         - Canned tuna (tunas)             1604.14.11.000            11,979            13,031              8,396  8.8  -35.6
         - Canned tuna (other)             1604.14.19.000            32,400            35,887            27,164  10.8  -24.3
    1.2 Tuna loin                          1604.14.90.000                207              1,937              2,819  833.8  45.6
    1.3 Tuna Petfood                       2309.10.10.001              6,332              6,797              8,691  7.3  27.9
                                                                                                   #DIV/0!   #DIV/0!
    2 Seafood                                                      10,124            8,906            8,599  -12.0  -3.4
    2.1 Sardine                            1604.13                    3,297              3,343              3,067  1.4  -8.3
    2.2 Salmon                             1604.11                    2,569              2,663              2,628  3.7  -1.3
    2.3 Mackerel                           1604.15                    2,795              1,491              1,341  -46.7  -10.0
    2.4 Canned Crab Meat                                                 168                103                146  -38.9  42.0
         - Canned Crab Meat (Sterilized)   1605.10.10.001                  49                  37                  28  -25.6  -24.8
         - Canned Crab Meat (Pasteurize)   1605.10.10.002                119                  66                118  -44.4  79.0
    2.5 Canned Shrimp                      1605.29.90.090                  59                  56                  50  -4.1  -10.6
    2.6 Canned Baby Clam                   1605.56                       133                164                192  23.4  17.0
    2.7 Canned Squid                       1605.54                    1,104              1,086              1,174  -1.6  8.1
    2.8 Abalone                            1605.57                       0.2                 0.2                 0.0  -0.2  -89.7
                                                                                                   #DIV/0!   #DIV/0!
    3 Pineapple                                                      9,632            8,810          11,524  -8.5  30.8
    3.1 Canned Pineapple                                              7,438              7,353              9,536  -1.1  29.7
          - Canned Pineapple (retail sale)  2008.20.10                4,770              5,126              6,224  7.5  21.4
          - Canned Pineapple (other)       2008.20.90                 2,668              2,226              3,312  -16.5  48.8
    3.2 Pineapple Juice, concentrate       2009.49                    2,116              1,368              1,851  -35.3  35.3
    3.3 Pineapple Juice, non concentrate   2009.41                        33                  34                  34  2.4  0.4
    3.4 Dried Pineapples                   0804.30.00.002                  45                  56                102  23.4  83.9
                                                                                          4,536

    4. Canned Sweet Corn                   2005.80                   4,048            4,540              3,312  #DIV/0!  #DIV/0!
                                                                                                                -0.1
                                                                                                      12.1
                                                                                                   #DIV/0!   #DIV/0!
    5 Fruit & Vegetable                                            27,068          28,365          28,134  4.8  -0.8
    5.1 Canned Lychee                      2008.99.10.001                175                150                157  -14.6  5.0
    5.2 Canned Longan                      2008.99.20.001                254                401                289  58.0  -27.9
    5.3 Canned Mango                       2008.99.40.001                 432                398                356  -7.9  -10.5
    5.4 Canned Fruit (tropical fruits)     2008.99.90.005                331                318                260  -3.8  -18.5
    5.5 Canned Rambutan                    2008.99.40.006                  47                  30                  21  -34.8  -31.0
    5.6 Canned Mixed Fruits                2008.97.90                 1,357              1,663              1,330  22.6  -20.0
    5.7 Canned Bamboo Shoot                2005.91                       234                309                289  32.5  -6.7
    5.8 Canned Pea (Pisum Satinvum)        2005.40                       104                116                131  11.7  12.8
    5.9 Tropical Fruit Salad               2008.97.20                    457                684                558  49.7  -18.3
      - Canned Rambutan with Pineapple     2008.97.20.001                103                  79                  82  -23.3  3.0
      - Fruit Cocktail (with papaya)       2008.97.20.002                  14                  19                  30  32.9  57.6
    5.10 Fruit Cocktail                    2008.99.20.002                  16                  11                    1  -31.3  -89.8
    5.11 Canned Processed Other Vetgetables  2005.99                  1,546              1,545              1,630  0.0  5.5
    5.11.1 Canned Processed Other Vetgetables   2005.99.10                733                661                661  -9.9  0.0
    (retail sale)
    5.11.2 Canned Processed Other Vetgetables
    (other)                                2005.99.90                    813                884                969  8.8  9.5
    5.11.1(1) Canned Young Corn                                          715                637                585  -10.8  -8.3
         - Canned Young Corn (retail sale)  2005.99.10.001                512                425                370  -17.0  -13.0
         - Canned Young Corn  (other)      2005.99.90.001                203                213                215  4.7  1.2
    5.11.1(2) Canned Salted Turnips                                       18                  16                  16  -8.4  -1.5
         - Canned Salted Turnips (retail sale)  2005.99.10.002                 5.8                 4.8                 2.8  -18.6  -40.6
         - Canned Salted Turnips (other)   2005.99.90.002               12.0               11.6               13.3  -3.4  14.4
    5.11.1(3) Canned Sliced Salted cucumbers                             -                    0               0.03