
Page 4 - 8. TFPA export to World in January-August 2021
P. 4
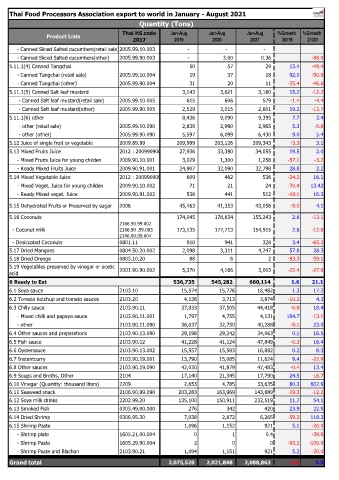
Thai Food Processors Association export to world in January - August 2021
                                                  Quantity (Tons)
                                            Thai HS.code     Jan-Aug      Jan-Aug       Jan-Aug   %Growth   %Growth
                 Product Lists
                                                2017          2019          2020         2021       20/19    21/20
         - Canned Sliced Salted cucumbers(retail sale)2005.99.10.003                   -                   -                   -
         - Canned Sliced Salted cucumbers(other)  2005.99.90.003                   -                  3.00                  0.36  -88.0
    5.11.1(4) Canned Tangchai                                                50                     57                     29  13.4  -49.4
         - Canned Tangchai (retail sale)   2005.99.10.004                     19                     37                     18  92.0  -50.9
         - Canned Tangchai (other)         2005.99.90.004                     31                     20                     11  -35.4  -46.6
    5.11.1(5) Canned Salt leaf mustard                                  3,143                3,621                3,180  15.2  -12.2
          - Canned Salt leaf mustard(retail sale)  2005.99.10.005                   615                   606                   579  -1.4  -4.4
          - Canned Salt leaf mustard(other)  2005.99.90.005                2,529                3,015                2,601  19.2  -13.7
    5.11.1(6) other                                                     8,436                9,090                9,395  7.7  3.4
          - other (retail sale)            2005.99.10.090                2,839                2,990                2,965  5.3  -0.8
          - other (other)                  2005.99.90.090                5,597                6,099                6,430  9.0  5.4
    5.12 Juice of single fruit or vegetable  2009.89.99              209,999            203,126            209,343  -3.3  3.1
    5.13 Mixed Fruits Juice                2012 : 20099090001            27,936              33,390              34,055  19.5  2.0
         - Mixed Fruits Juice for young childen  2009.90.10.001                3,029                1,300                1,258  -57.1  -3.2
         - Ready Mixed Fruits Juice        2009.90.91.001              24,907              32,090              32,798  28.8  2.2
    5.14 Mixed Vegetable Juice             2012 : 20099090002                 609                   462                   536  -24.2  16.1
         - Mixed Veget. Juice for young childen  2009.90.10.002                     71                     21                     24  -70.4  13.42
         - Ready Mixed veget. Juice        2009.90.91.002                   538                   441                   512  -18.1  16.3
    5.15 Dehydrated Fruits or Preserved by sugar  2006                 45,463              41,353              43,058  -9.0  4.1

    5.16 Coconuts                                                    174,045            178,654            155,243  2.6  -13.1
                                           2106.90.99.002
      - Coconut milk                       2106.90 .99.003            173,135            177,713            154,915  2.6  -12.8
                                           2106.90.99.004
      - Desiccated Coconuts                0801.11                         910                   941                   328  3.4  -65.2
    5.17 Dried Mangoes                     0804.50.20.002                2,098                3,311                4,247  57.8  28.3
    5.18 Dried Orenge                      0805.10.20                        88                      6                      2  -93.3  -59.1
    5.19 Vegetables preserved by vinegar or acetic   2001.90.90.002                5,370                4,166                3,003  -22.4  -27.9
    acid
                                                                                                    #DIV/0!  #DIV/0!
    6 Ready to Eat                                                 536,735          545,282          660,114  1.6  21.1
    6.1 Soya sauce                         2103.10               15,574       15,776       18,482       1.3    17.2
    6.2 Tomato ketchup and tomato sauces   2103.20                4,136        3,713        3,874     -10.2     4.3
    6.3 Chilly sauce                       2103.90.11            37,833       37,505       44,418      -0.9    18.4
         - Mixed chilli and papaya sauce   2103.90.11.001         1,797        4,755        4,131     164.7   -13.1
         - other                           2103.90.11.090        36,037       32,750       40,288      -9.1    23.0
    6.4 Other sauces and preparations      2103.90.13.090        29,198       29,242       34,063       0.1    16.5
    6.5 Fish sauce                         2103.90.12            41,228       41,124       47,849      -0.3    16.4
    6.6 Oystersauce                        2103.90.13.002        15,557       15,583       16,882       0.2     8.3
    6.7 Instantcurry                       2103.90.19.001        13,790       15,085       11,624       9.4   -22.9
    6.8 Other sauces                       2103.90.19.090        42,030       41,879       47,483      -0.4    13.4
    6.9 Soups and Broths, Other            2104                  17,140       21,345       17,790      24.5   -16.7
    6.10 Vinegar (Quantity: thousand liters)  2209                2,653        4,785       33,635      80.3   602.9
    6.11 Seaweed snack                     2106.90.99.090       203,283      163,969      143,889     -19.3   -12.2
    6.12 Soya milk drinks                  2202.99.20           135,100      150,911      232,519      11.7    54.1
    6.13 Smoked Fish                       0305.49.00.000          276           342          420      23.9    22.9
    6.14 Dried Shrimp                      0306.95.30             7,038        2,872        6,265     -59.2   118.2
    6.15 Shrimp Paste                                             1,096        1,152          921       5.1   -20.0
         - Shrimp plate                    1605.21.00.004            0             1          0.4             -39.6
         - Shrimp Paste                    1605.29.90.004            2             0            0     -93.2  -100.0
         - Shrimp Paste and Blachan        2103.90.21             1,094        1,151          921       5.2   -20.0

    Grand total                                                 2,075,520       2,021,848       2,088,863  -2.6  3.3