
Page 2 - 8. TFPA export to World in January-August 2021
P. 2
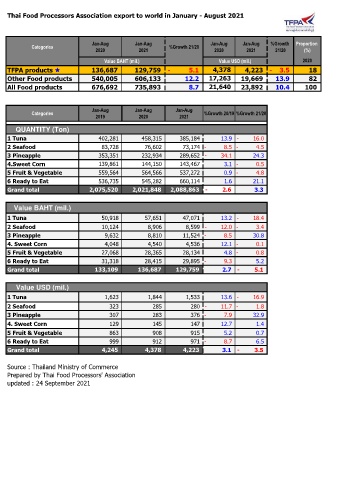
Thai Food Processors Association export to world in January - August 2021
Jan-Aug Jan-Aug Jan-Aug Jan-Aug %Growth Proportion
Categories %Growth 21/20
2020 2021 2020 2021 21/20 (%)
Value BAHT (mil.) Value USD (mil.) 2020
TFPA products 136,687 129,759 - 5.1 4,378 4,223 - 3.5 18
Other Food products 540,005 606,133 12.2 17,263 19,669 13.9 82
All Food products 676,692 735,893 8.7 21,640 23,892 10.4 100
Jan-Aug Jan-Aug Jan-Aug
Categories %Growth 20/19 %Growth 21/20
2019 2020 2021
QUANTITY (Ton)
1 Tuna 402,281 458,315 385,184 13.9 - 16.0
2 Seafood 83,728 76,602 73,174 - 8.5 - 4.5
3 Pineapple 353,351 232,934 289,652 - 34.1 24.3
4.Sweet Corn 139,861 144,150 143,467 3.1 - 0.5
5 Fruit & Vegetable 559,564 564,566 537,272 0.9 - 4.8
6 Ready to Eat 536,735 545,282 660,114 1.6 21.1
Grand total 2,075,520 2,021,848 2,088,863 - 2.6 3.3
Value BAHT (mil.)
1 Tuna 50,918 57,651 47,071 13.2 - 18.4
2 Seafood 10,124 8,906 8,599 - 12.0 - 3.4
3 Pineapple 9,632 8,810 11,524 - 8.5 30.8
4. Sweet Corn 4,048 4,540 4,536 12.1 - 0.1
5 Fruit & Vegetable 27,068 28,365 28,134 4.8 - 0.8
6 Ready to Eat 31,318 28,415 29,895 - 9.3 5.2
Grand total 133,109 136,687 129,759 2.7 - 5.1
Value USD (mil.)
1 Tuna 1,623 1,844 1,533 13.6 - 16.9
2 Seafood 323 285 280 - 11.7 - 1.8
3 Pineapple 307 283 376 - 7.9 32.9
4. Sweet Corn 129 145 147 12.7 1.4
5 Fruit & Vegetable 863 908 915 5.2 0.7
6 Ready to Eat 999 912 971 - 8.7 6.5
Grand total 4,245 4,378 4,223 3.1 - 3.5
Source : Thailand Ministry of Commerce
Prepared by Thai Food Processors' Association
updated : 24 September 2021