Page 3 - 8. TFPA export to World in January-August 2021
P. 3

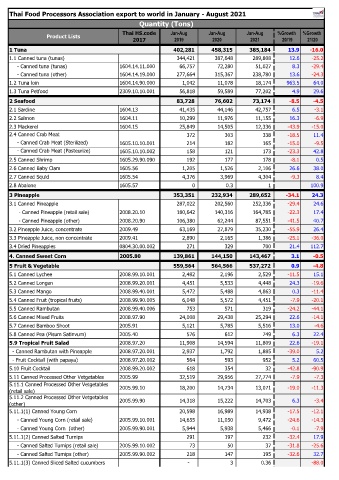
Thai Food Processors Association export to world in January - August 2021
                                                  Quantity (Tons)
                                            Thai HS.code     Jan-Aug      Jan-Aug       Jan-Aug   %Growth   %Growth
                 Product Lists
                                                2017          2019          2020         2021       20/19    21/20
    1 Tuna                                                         402,281          458,315          385,184  13.9  -16.0
    1.1 Canned tuna (tunas)                                          344,421            387,648            289,808  12.6  -25.2
         - Canned tuna (tunas)             1604.14.11.000              66,757              72,280              51,027  8.3  -29.4
         - Canned tuna (other)             1604.14.19.000            277,664            315,367            238,780  13.6  -24.3
    1.2 Tuna loin                          1604.14.90.000                1,042              11,078              18,174  963.5  64.0
    1.3 Tuna Petfood                       2309.10.10.001              56,818              59,589              77,202  4.9  29.6
                                                                                                    #DIV/0!  #DIV/0!
    2 Seafood                                                        83,728             76,602             73,174  -8.5  -4.5
    2.1 Sardine                            1604.13                     41,435              44,146              42,757  6.5  -3.1
    2.2 Salmon                             1604.11                     10,299              11,976              11,155  16.3  -6.9
    2.3 Mackerel                           1604.15                     25,849              14,505              12,336  -43.9  -15.0
    2.4 Canned Crab Meat                                                   372                   303                   338  -18.5  11.4
         - Canned Crab Meat (Sterilized)   1605.10.10.001                   214                   182                   165  -15.0  -9.5
         - Canned Crab Meat (Pasteurize)   1605.10.10.002                   158                   121                   173  -23.3  42.8
    2.5 Canned Shrimp                      1605.29.90.090                   192                   177                   178  -8.1  0.5
    2.6 Canned Baby Clam                   1605.56                      1,205                1,526                2,106  26.6  38.0
    2.7 Canned Squid                       1605.54                      4,376                3,969                4,304  -9.3  8.4
    2.8 Abalone                            1605.57                             0                    0.3                      1  100.9
                                                                                                    #DIV/0!  #DIV/0!
    3 Pineapple                                                    353,351          232,934          289,652  -34.1  24.3
    3.1 Canned Pineapple                                             287,022            202,560            252,336  -29.4  24.6
          - Canned Pineapple (retail sale)  2008.20.10               180,642            140,316            164,785  -22.3  17.4
          - Canned Pineapple (other)       2008.20.90                106,380              62,244              87,551  -41.5  40.7
    3.2 Pineapple Juice, concentrate       2009.49                     63,169              27,879              35,230  -55.9  26.4
    3.3 Pineapple Juice, non concentrate   2009.41                      2,890                2,165                1,386  -25.1  -36.0
    3.4 Dried Pineapples                   0804.30.00.002                   271                   329                   700  21.4  112.7
                                                                       54,739              55,171                   144  0.8  -99.7
    4. Canned Sweet Corn                   2005.80                 139,861          144,150          143,467  3.1  -0.5
                                                                                                  #DIV/0! #####
    5 Fruit & Vegetable                                            559,564          564,566          537,272  0.9  -4.8
    5.1 Canned Lychee                      2008.99.10.001                2,482                2,196                2,529  -11.5  15.1
    5.2 Canned Longan                      2008.99.20.001                4,451                5,533                4,448  24.3  -19.6
    5.3 Canned Mango                       2008.99.40.001                 5,472                5,488                4,863  0.3  -11.4
    5.4 Canned Fruit (tropical fruits)     2008.99.90.005                6,048                5,572                4,451  -7.9  -20.1
    5.5 Canned Rambutan                    2008.99.40.006                   753                   571                   319  -24.2  -44.1
    5.6 Canned Mixed Fruits                2008.97.90                  24,008              29,438              25,294  22.6  -14.1
    5.7 Canned Bamboo Shoot                2005.91                      5,121                5,785                5,516  13.0  -4.6
    5.8 Canned Pea (Pisum Satinvum)        2005.40                         576                   612                   749  6.3  22.4
    5.9 Tropical Fruit Salad               2008.97.20                  11,908              14,594              11,809  22.6  -19.1
      - Canned Rambutan with Pineapple     2008.97.20.001                2,937                1,792                1,885  -39.0  5.2
      - Fruit Cocktail (with papaya)       2008.97.20.002                   564                   593                   952  5.2  60.5
    5.10 Fruit Cocktail                    2008.99.20.002                   618                   354                     32  -42.8  -90.9
    5.11 Canned Processed Other Vetgetables  2005.99                   32,519              29,956              27,774  -7.9  -7.3
    5.11.1 Canned Processed Other Vetgetables   2005.99.10              18,200              14,734              13,071  -19.0  -11.3
    (retail sale)
    5.11.2 Canned Processed Other Vetgetables   2005.99.90              14,318              15,222              14,703  6.3  -3.4
    (other)
    5.11.1(1) Canned Young Corn                                        20,598              16,989              14,938  -17.5  -12.1
         - Canned Young Corn (retail sale)  2005.99.10.001              14,655              11,050                9,472  -24.6  -14.3
         - Canned Young Corn  (other)      2005.99.90.001                5,944                5,938                5,466  -0.1  -7.9
    5.11.1(2) Canned Salted Turnips                                        291                   197                   232  -32.4  17.9
         - Canned Salted Turnips (retail sale)  2005.99.10.002                     73                     50                     37  -31.8  -25.6
         - Canned Salted Turnips (other)   2005.99.90.002                   218                   147                   195  -32.6  32.7
    5.11.1(3) Canned Sliced Salted cucumbers                                -                      3                  0.36  -88.0
   1   2   3   4   5   6   7   8