
Page 4 - 7. TFPA export to World in January-July 2021
P. 4
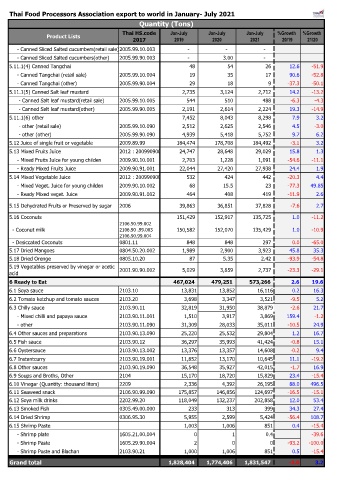
Thai Food Processors Association export to world in January- July 2021
                                                  Quantity (Tons)
                                            Thai HS.code     Jan-July     Jan-July      Jan-July  %Growth   %Growth
                 Product Lists
                                                2017          2019          2020         2021       20/19    21/20
         - Canned Sliced Salted cucumbers(retail sale)2005.99.10.003                   -                   -                   -
         - Canned Sliced Salted cucumbers(other)  2005.99.90.003                   -                  3.00                   -
    5.11.1(4) Canned Tangchai                                                48                     54                     26  12.6  -51.9
         - Canned Tangchai (retail sale)   2005.99.10.004                     19                     35                     17  90.6  -52.8
         - Canned Tangchai (other)         2005.99.90.004                     29                     18                      9  -37.3  -50.1
    5.11.1(5) Canned Salt leaf mustard                                  2,735                3,124                2,712  14.2  -13.2
          - Canned Salt leaf mustard(retail sale)  2005.99.10.005                   544                   510                   488  -6.3  -4.3
          - Canned Salt leaf mustard(other)  2005.99.90.005                2,191                2,614                2,224  19.3  -14.9
    5.11.1(6) other                                                     7,452                8,043                8,298  7.9  3.2
          - other (retail sale)            2005.99.10.090                2,512                2,625                2,546  4.5  -3.0
          - other (other)                  2005.99.90.090                4,939                5,418                5,752  9.7  6.2
    5.12 Juice of single fruit or vegetable  2009.89.99              184,474            178,708            184,492  -3.1  3.2
    5.13 Mixed Fruits Juice                2012 : 20099090001            24,747              28,648              29,029  15.8  1.3
         - Mixed Fruits Juice for young childen  2009.90.10.001                2,703                1,228                1,091  -54.6  -11.1
         - Ready Mixed Fruits Juice        2009.90.91.001              22,044              27,420              27,938  24.4  1.9
    5.14 Mixed Vegetable Juice             2012 : 20099090002                 532                   424                   442  -20.3  4.4
         - Mixed Veget. Juice for young childen  2009.90.10.002                     68                  15.5                     23  -77.3  49.85
         - Ready Mixed veget. Juice        2009.90.91.002                   464                   408                   419  -11.9  2.6
    5.15 Dehydrated Fruits or Preserved by sugar  2006                 39,863              36,851              37,828  -7.6  2.7

    5.16 Coconuts                                                    151,429            152,917            135,725  1.0  -11.2
                                           2106.90.99.002
      - Coconut milk                       2106.90 .99.003            150,582            152,070            135,429  1.0  -10.9
                                           2106.90.99.004
      - Desiccated Coconuts                0801.11                         848                   848                   297  0.0  -65.0
    5.17 Dried Mangoes                     0804.50.20.002                1,989                2,900                3,923  45.8  35.3
    5.18 Dried Orenge                      0805.10.20                        87                  5.35                  2.42  -93.9  -54.8
    5.19 Vegetables preserved by vinegar or acetic   2001.90.90.002                5,029                3,859                2,737  -23.3  -29.1
    acid
                                                                                                    #DIV/0!  #DIV/0!
    6 Ready to Eat                                                 467,024          479,251          573,266  2.6  19.6
    6.1 Soya sauce                         2103.10               13,831       13,852       16,116       0.2    16.3
    6.2 Tomato ketchup and tomato sauces   2103.20                3,698        3,347        3,521      -9.5     5.2
    6.3 Chilly sauce                       2103.90.11            32,819       31,950       38,879      -2.6    21.7
         - Mixed chilli and papaya sauce   2103.90.11.001         1,510        3,917        3,869     159.4    -1.2
         - other                           2103.90.11.090        31,309       28,033       35,011     -10.5    24.9
    6.4 Other sauces and preparations      2103.90.13.090        25,220       25,532       29,804       1.2    16.7
    6.5 Fish sauce                         2103.90.12            36,297       35,993       41,424      -0.8    15.1
    6.6 Oystersauce                        2103.90.13.002        13,376       13,357       14,608      -0.2     9.4
    6.7 Instantcurry                       2103.90.19.001        11,852       13,170       10,645      11.1   -19.2
    6.8 Other sauces                       2103.90.19.090        36,548       35,927       42,015      -1.7    16.9
    6.9 Soups and Broths, Other            2104                  15,170       18,720       15,829      23.4   -15.4
    6.10 Vinegar (Quantity: thousand liters)  2209                2,336        4,392       26,195      88.0   496.5
    6.11 Seaweed snack                     2106.90.99.090       175,857      146,856      124,697     -16.5   -15.1
    6.12 Soya milk drinks                  2202.99.20           118,049      132,237      202,858      12.0    53.4
    6.13 Smoked Fish                       0305.49.00.000          233           313          399      34.3    27.4
    6.14 Dried Shrimp                      0306.95.30             5,955        2,599        5,424     -56.4   108.7
    6.15 Shrimp Paste                                             1,003        1,006          851       0.4   -15.4
         - Shrimp plate                    1605.21.00.004            0             1          0.4             -39.6
         - Shrimp Paste                    1605.29.90.004            2             0            0     -93.2  -100.0
         - Shrimp Paste and Blachan        2103.90.21             1,000        1,006          851       0.5   -15.4

    Grand total                                                 1,828,404       1,774,406       1,831,547  -3.0  3.2