
Page 2 - 7. TFPA export to World in January-July 2021
P. 2
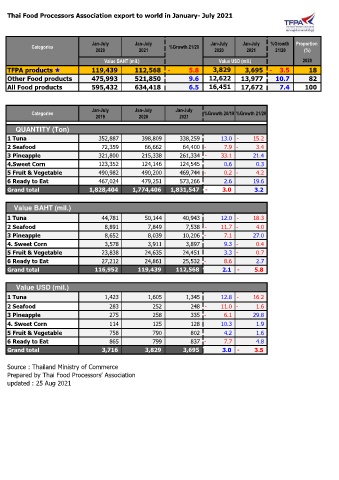
Thai Food Processors Association export to world in January- July 2021
Jan-July Jan-July Jan-July Jan-July %Growth Proportion
Categories %Growth 21/20
2020 2021 2020 2021 21/20 (%)
Value BAHT (mil.) Value USD (mil.) 2020
TFPA products 119,439 112,568 - 5.8 3,829 3,695 - 3.5 18
Other Food products 475,993 521,850 9.6 12,622 13,977 10.7 82
All Food products 595,432 634,418 6.5 16,451 17,672 7.4 100
Jan-July Jan-July Jan-July
Categories %Growth 20/19 %Growth 21/20
2019 2020 2021
QUANTITY (Ton)
1 Tuna 352,887 398,809 338,259 13.0 - 15.2
2 Seafood 72,359 66,662 64,400 - 7.9 - 3.4
3 Pineapple 321,800 215,338 261,334 - 33.1 21.4
4.Sweet Corn 123,352 124,146 124,545 0.6 0.3
5 Fruit & Vegetable 490,982 490,200 469,744 - 0.2 - 4.2
6 Ready to Eat 467,024 479,251 573,266 2.6 19.6
Grand total 1,828,404 1,774,406 1,831,547 - 3.0 3.2
Value BAHT (mil.)
1 Tuna 44,781 50,144 40,943 12.0 - 18.3
2 Seafood 8,891 7,849 7,538 - 11.7 - 4.0
3 Pineapple 8,652 8,039 10,206 - 7.1 27.0
4. Sweet Corn 3,578 3,911 3,897 9.3 - 0.4
5 Fruit & Vegetable 23,838 24,635 24,451 3.3 - 0.7
6 Ready to Eat 27,212 24,861 25,532 - 8.6 2.7
Grand total 116,952 119,439 112,568 2.1 - 5.8
Value USD (mil.)
1 Tuna 1,423 1,605 1,345 12.8 - 16.2
2 Seafood 283 252 248 - 11.0 - 1.6
3 Pineapple 275 258 335 - 6.1 29.8
4. Sweet Corn 114 125 128 10.3 1.9
5 Fruit & Vegetable 758 790 802 4.2 1.6
6 Ready to Eat 865 799 837 - 7.7 4.8
Grand total 3,716 3,829 3,695 3.0 - 3.5
Source : Thailand Ministry of Commerce
Prepared by Thai Food Processors' Association
updated : 25 Aug 2021