
Page 3 - 7. TFPA export to World in January-July 2021
P. 3
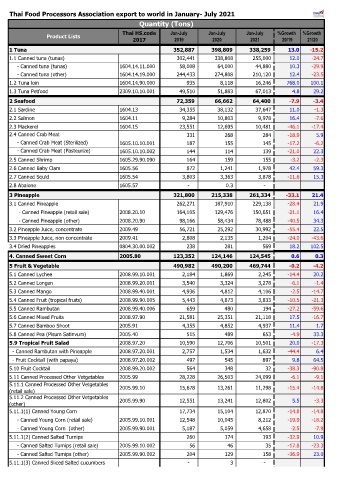
Thai Food Processors Association export to world in January- July 2021
                                                  Quantity (Tons)
                                            Thai HS.code     Jan-July     Jan-July      Jan-July  %Growth   %Growth
                 Product Lists
                                                2017          2019          2020         2021       20/19    21/20
    1 Tuna                                                         352,887          398,809          338,259  13.0  -15.2
    1.1 Canned tuna (tunas)                                          302,441            338,808            255,000  12.0  -24.7
         - Canned tuna (tunas)             1604.14.11.000              58,008              64,000              44,880  10.3  -29.9
         - Canned tuna (other)             1604.14.19.000            244,433            274,808            210,120  12.4  -23.5
    1.2 Tuna loin                          1604.14.90.000                   935                8,118              16,246  768.0  100.1
    1.3 Tuna Petfood                       2309.10.10.001              49,510              51,883              67,013  4.8  29.2
                                                                                                    #DIV/0!  #DIV/0!
    2 Seafood                                                        72,359             66,662             64,400  -7.9  -3.4
    2.1 Sardine                            1604.13                     34,355              38,132              37,647  11.0  -1.3
    2.2 Salmon                             1604.11                      9,284              10,803                9,978  16.4  -7.6
    2.3 Mackerel                           1604.15                     23,551              12,695              10,481  -46.1  -17.4
    2.4 Canned Crab Meat                                                   331                   268                   284  -18.9  5.9
         - Canned Crab Meat (Sterilized)   1605.10.10.001                   187                   155                   145  -17.2  -6.2
         - Canned Crab Meat (Pasteurize)   1605.10.10.002                   144                   114                   139  -21.0  22.3
    2.5 Canned Shrimp                      1605.29.90.090                   164                   159                   155  -3.2  -2.3
    2.6 Canned Baby Clam                   1605.56                         872                1,241                1,978  42.4  59.3
    2.7 Canned Squid                       1605.54                      3,803                3,363                3,878  -11.6  15.3
    2.8 Abalone                            1605.57                          -                    0.3                   -
                                                                                                    #DIV/0!  #DIV/0!
    3 Pineapple                                                    321,800          215,338          261,334  -33.1  21.4
    3.1 Canned Pineapple                                             262,271            187,910            229,138  -28.4  21.9
          - Canned Pineapple (retail sale)  2008.20.10               164,105            129,476            150,651  -21.1  16.4
          - Canned Pineapple (other)       2008.20.90                  98,166              58,434              78,488  -40.5  34.3
    3.2 Pineapple Juice, concentrate       2009.49                     56,721              25,292              30,992  -55.4  22.5
    3.3 Pineapple Juice, non concentrate   2009.41                      2,808                2,135                1,204  -24.0  -43.6
    3.4 Dried Pineapples                   0804.30.00.002                   238                   281                   569  18.2  102.5
                                                                       54,739              55,171                   144  0.8  -99.7
    4. Canned Sweet Corn                   2005.80                 123,352          124,146          124,545  0.6  0.3
                                                                                                  #DIV/0! #####
    5 Fruit & Vegetable                                            490,982          490,200          469,744  -0.2  -4.2
    5.1 Canned Lychee                      2008.99.10.001                2,184                1,869                2,245  -14.4  20.2
    5.2 Canned Longan                      2008.99.20.001                3,540                3,324                3,278  -6.1  -1.4
    5.3 Canned Mango                       2008.99.40.001                 4,936                4,812                4,106  -2.5  -14.7
    5.4 Canned Fruit (tropical fruits)     2008.99.90.005                5,443                4,873                3,833  -10.5  -21.3
    5.5 Canned Rambutan                    2008.99.40.006                   659                   480                   194  -27.2  -59.6
    5.6 Canned Mixed Fruits                2008.97.90                  21,581              25,351              21,118  17.5  -16.7
    5.7 Canned Bamboo Shoot                2005.91                      4,355                4,852                4,937  11.4  1.7
    5.8 Canned Pea (Pisum Satinvum)        2005.40                         515                   489                   653  -4.9  33.3
    5.9 Tropical Fruit Salad               2008.97.20                  10,590              12,706              10,501  20.0  -17.3
      - Canned Rambutan with Pineapple     2008.97.20.001                2,757                1,534                1,632  -44.4  6.4
      - Fruit Cocktail (with papaya)       2008.97.20.002                   497                   545                   897  9.8  64.5
    5.10 Fruit Cocktail                    2008.99.20.002                   564                   348                     32  -38.3  -90.8
    5.11 Canned Processed Other Vetgetables  2005.99                   28,228              26,503              24,099  -6.1  -9.1
    5.11.1 Canned Processed Other Vetgetables   2005.99.10              15,678              13,261              11,298  -15.4  -14.8
    (retail sale)
    5.11.2 Canned Processed Other Vetgetables   2005.99.90              12,551              13,241              12,802  5.5  -3.3
    (other)
    5.11.1(1) Canned Young Corn                                        17,734              15,104              12,870  -14.8  -14.8
         - Canned Young Corn (retail sale)  2005.99.10.001              12,548              10,045                8,212  -19.9  -18.2
         - Canned Young Corn  (other)      2005.99.90.001                5,187                5,059                4,658  -2.5  -7.9
    5.11.1(2) Canned Salted Turnips                                        260                   174                   193  -32.9  10.9
         - Canned Salted Turnips (retail sale)  2005.99.10.002                     56                     46                     35  -17.8  -23.3
         - Canned Salted Turnips (other)   2005.99.90.002                   204                   129                   158  -36.9  23.0
    5.11.1(3) Canned Sliced Salted cucumbers                                -                      3                   -