
Page 4 - 5. TFPA export to World in January-May 2021
P. 4
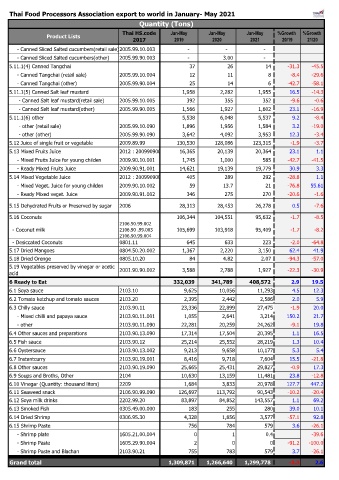
Thai Food Processors Association export to world in January- May 2021
                                                  Quantity (Tons)
                                            Thai HS.code     Jan-May      Jan-May       Jan-May   %Growth   %Growth
                 Product Lists
                                                2017          2019          2020         2021       20/19    21/20
         - Canned Sliced Salted cucumbers(retail sale)2005.99.10.003                   -                   -                   -
         - Canned Sliced Salted cucumbers(other)  2005.99.90.003                   -                  3.00                   -
    5.11.1(4) Canned Tangchai                                                37                     26                     14  -31.3  -45.5
         - Canned Tangchai (retail sale)   2005.99.10.004                     12                     11                      8  -8.4  -29.6
         - Canned Tangchai (other)         2005.99.90.004                     25                     14                      6  -42.7  -58.1
    5.11.1(5) Canned Salt leaf mustard                                  1,958                2,282                1,955  16.5  -14.3
          - Canned Salt leaf mustard(retail sale)  2005.99.10.005                   392                   355                   352  -9.6  -0.6
          - Canned Salt leaf mustard(other)  2005.99.90.005                1,566                1,927                1,602  23.1  -16.9
    5.11.1(6) other                                                     5,538                6,048                5,537  9.2  -8.4
          - other (retail sale)            2005.99.10.090                1,896                1,956                1,584  3.2  -19.0
          - other (other)                  2005.99.90.090                3,642                4,092                3,953  12.3  -3.4
    5.12 Juice of single fruit or vegetable  2009.89.99              130,530            128,086            123,315  -1.9  -3.7
    5.13 Mixed Fruits Juice                2012 : 20099090001            16,365              20,139              20,364  23.1  1.1
         - Mixed Fruits Juice for young childen  2009.90.10.001                1,745                1,000                   585  -42.7  -41.5
         - Ready Mixed Fruits Juice        2009.90.91.001              14,621              19,139              19,779  30.9  3.3
    5.14 Mixed Vegetable Juice             2012 : 20099090002                 405                   289                   292  -28.8  1.1
         - Mixed Veget. Juice for young childen  2009.90.10.002                     59                  13.7                     21  -76.8  55.61
         - Ready Mixed veget. Juice        2009.90.91.002                   346                   275                   270  -20.6  -1.6
    5.15 Dehydrated Fruits or Preserved by sugar  2006                 28,313              28,453              26,278  0.5  -7.6

    5.16 Coconuts                                                    106,344            104,551              95,632  -1.7  -8.5
                                           2106.90.99.002
      - Coconut milk                       2106.90 .99.003            105,699            103,918              95,409  -1.7  -8.2
                                           2106.90.99.004
      - Desiccated Coconuts                0801.11                         645                   633                   223  -2.0  -64.8
    5.17 Dried Mangoes                     0804.50.20.002                1,367                2,220                3,150  62.4  41.9
    5.18 Dried Orenge                      0805.10.20                        84                  4.82                  2.07  -94.3  -57.0
    5.19 Vegetables preserved by vinegar or acetic   2001.90.90.002                3,588                2,788                1,927  -22.3  -30.9
    acid
                                                                                                    #DIV/0!  #DIV/0!
    6 Ready to Eat                                                 332,039          341,789          408,572  2.9  19.5
    6.1 Soya sauce                         2103.10                9,625       10,056       11,293       4.5    12.3
    6.2 Tomato ketchup and tomato sauces   2103.20                2,395        2,442        2,586       2.0     5.9
    6.3 Chilly sauce                       2103.90.11            23,336       22,899       27,475      -1.9    20.0
         - Mixed chilli and papaya sauce   2103.90.11.001         1,055        2,641        3,214     150.2    21.7
         - other                           2103.90.11.090        22,281       20,259       24,262      -9.1    19.8
    6.4 Other sauces and preparations      2103.90.13.090        17,314       17,504       20,395       1.1    16.5
    6.5 Fish sauce                         2103.90.12            25,214       25,552       28,219       1.3    10.4
    6.6 Oystersauce                        2103.90.13.002         9,213        9,658       10,177       5.3     5.4
    6.7 Instantcurry                       2103.90.19.001         8,416        9,718        7,604      15.5   -21.8
    6.8 Other sauces                       2103.90.19.090        25,665       25,431       29,827      -0.9    17.3
    6.9 Soups and Broths, Other            2104                  10,630       13,159       11,481      23.8   -12.8
    6.10 Vinegar (Quantity: thousand liters)  2209                1,684        3,833       20,978     127.7   447.2
    6.11 Seaweed snack                     2106.90.99.090       126,697      113,792       90,543     -10.2   -20.4
    6.12 Soya milk drinks                  2202.99.20            83,897       84,852      143,557       1.1    69.2
    6.13 Smoked Fish                       0305.49.00.000          183           255          280      39.0    10.1
    6.14 Dried Shrimp                      0306.95.30             4,328        1,856        3,577     -57.1    92.8
    6.15 Shrimp Paste                                              756           784          579       3.6   -26.1
         - Shrimp plate                    1605.21.00.004            0             1          0.4             -39.6
         - Shrimp Paste                    1605.29.90.004            2             0            0     -91.2  -100.0
         - Shrimp Paste and Blachan        2103.90.21              755           783          579       3.7   -26.1

    Grand total                                                 1,309,871       1,266,640       1,299,778  -3.3  2.6