
Page 3 - 5. TFPA export to World in January-May 2021
P. 3
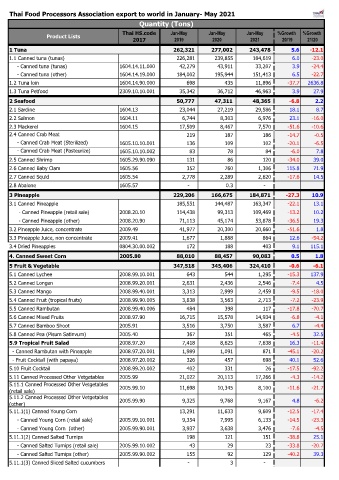
Thai Food Processors Association export to world in January- May 2021
                                                  Quantity (Tons)
                                            Thai HS.code     Jan-May      Jan-May       Jan-May   %Growth   %Growth
                 Product Lists
                                                2017          2019          2020         2021       20/19    21/20
    1 Tuna                                                         262,321          277,002          243,478  5.6  -12.1
    1.1 Canned tuna (tunas)                                          226,281            239,855            184,619  6.0  -23.0
         - Canned tuna (tunas)             1604.14.11.000              42,279              43,911              33,207  3.9  -24.4
         - Canned tuna (other)             1604.14.19.000            184,002            195,944            151,413  6.5  -22.7
    1.2 Tuna loin                          1604.14.90.000                   698                   435              11,896  -37.7  2636.8
    1.3 Tuna Petfood                       2309.10.10.001              35,342              36,712              46,963  3.9  27.9
                                                                                                    #DIV/0!  #DIV/0!
    2 Seafood                                                        50,777             47,311             48,365  -6.8  2.2
    2.1 Sardine                            1604.13                     23,044              27,219              29,586  18.1  8.7
    2.2 Salmon                             1604.11                      6,744                8,303                6,976  23.1  -16.0
    2.3 Mackerel                           1604.15                     17,509                8,467                7,570  -51.6  -10.6
    2.4 Canned Crab Meat                                                   219                   187                   186  -14.7  -0.5
         - Canned Crab Meat (Sterilized)   1605.10.10.001                   136                   109                   102  -20.1  -6.5
         - Canned Crab Meat (Pasteurize)   1605.10.10.002                     83                     78                     84  -6.0  7.8
    2.5 Canned Shrimp                      1605.29.90.090                   131                     86                   120  -34.0  39.0
    2.6 Canned Baby Clam                   1605.56                         352                   760                1,306  115.8  71.9
    2.7 Canned Squid                       1605.54                      2,778                2,289                2,620  -17.6  14.5
    2.8 Abalone                            1605.57                          -                    0.3                   -
                                                                                                    #DIV/0!  #DIV/0!
    3 Pineapple                                                    229,206          166,675          184,871  -27.3  10.9
    3.1 Canned Pineapple                                             185,551            144,487            163,347  -22.1  13.1
          - Canned Pineapple (retail sale)  2008.20.10               114,438              99,313            109,469  -13.2  10.2
          - Canned Pineapple (other)       2008.20.90                  71,113              45,174              53,878  -36.5  19.3
    3.2 Pineapple Juice, concentrate       2009.49                     41,977              20,300              20,660  -51.6  1.8
    3.3 Pineapple Juice, non concentrate   2009.41                      1,677                1,888                   864  12.6  -54.2
    3.4 Dried Pineapples                   0804.30.00.002                   172                   188                   403  9.1  115.1
                                                                       54,739              55,171                   144  0.8  -99.7
    4. Canned Sweet Corn                   2005.80                   88,010             88,457             90,083  0.5  1.8
                                                                                                  #DIV/0! #####
    5 Fruit & Vegetable                                            347,518          345,406          324,410  -0.6  -6.1
    5.1 Canned Lychee                      2008.99.10.001                   643                   544                1,295  -15.3  137.9
    5.2 Canned Longan                      2008.99.20.001                2,631                2,436                2,546  -7.4  4.5
    5.3 Canned Mango                       2008.99.40.001                 3,313                2,999                2,459  -9.5  -18.0
    5.4 Canned Fruit (tropical fruits)     2008.99.90.005                3,838                3,563                2,713  -7.2  -23.9
    5.5 Canned Rambutan                    2008.99.40.006                   484                   398                   117  -17.8  -70.7
    5.6 Canned Mixed Fruits                2008.97.90                  16,715              15,578              14,934  -6.8  -4.1
    5.7 Canned Bamboo Shoot                2005.91                      3,516                3,750                3,587  6.7  -4.4
    5.8 Canned Pea (Pisum Satinvum)        2005.40                         367                   351                   465  -4.5  32.5
    5.9 Tropical Fruit Salad               2008.97.20                   7,418                8,625                7,638  16.3  -11.4
      - Canned Rambutan with Pineapple     2008.97.20.001                1,989                1,091                   871  -45.1  -20.2
      - Fruit Cocktail (with papaya)       2008.97.20.002                   326                   457                   698  40.1  52.6
    5.10 Fruit Cocktail                    2008.99.20.002                   402                   331                     26  -17.5  -92.2
    5.11 Canned Processed Other Vetgetables  2005.99                   21,022              20,113              17,266  -4.3  -14.2
    5.11.1 Canned Processed Other Vetgetables   2005.99.10              11,698              10,345                8,100  -11.6  -21.7
    (retail sale)
    5.11.2 Canned Processed Other Vetgetables   2005.99.90                9,325                9,768                9,167  4.8  -6.2
    (other)
    5.11.1(1) Canned Young Corn                                        13,291              11,633                9,609  -12.5  -17.4
         - Canned Young Corn (retail sale)  2005.99.10.001                9,354                7,995                6,133  -14.5  -23.3
         - Canned Young Corn  (other)      2005.99.90.001                3,937                3,638                3,476  -7.6  -4.5
    5.11.1(2) Canned Salted Turnips                                        198                   121                   151  -38.8  25.1
         - Canned Salted Turnips (retail sale)  2005.99.10.002                     43                     29                     23  -33.8  -20.7
         - Canned Salted Turnips (other)   2005.99.90.002                   155                     92                   129  -40.2  39.3
    5.11.1(3) Canned Sliced Salted cucumbers                                -                      3                   -