Page 2 - 5. TFPA export to World in January-May 2021
P. 2

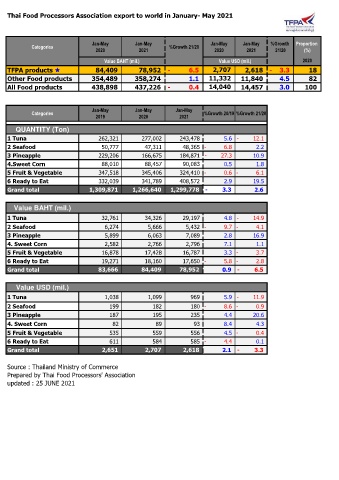
Thai Food Processors Association export to world in January- May 2021


                                 Jan-May        Jan-May                    Jan-May    Jan-May   %Growth   Proportion
            Categories                                      %Growth 21/20
                                   2020           2021                      2020        2021      21/20     (%)
                                      Value BAHT (mil.)                       Value USD (mil.)             2020
    TFPA products                     84,409           78,952  -            6.5       2,707       2,618  -      3.3          18
    Other Food products             354,489        358,274               1.1     11,332     11,840        4.5          82
    All Food products                438,898        437,226  -            0.4     14,040     14,457        3.0       100


                                 Jan-May        Jan-May        Jan-May
            Categories                                                   %Growth 20/19 %Growth 21/20
                                   2019           2020          2021
       QUANTITY (Ton)
    1 Tuna                               262,321             277,002          243,478              5.6 -          12.1
    2 Seafood                              50,777               47,311            48,365 -            6.8              2.2
    3 Pineapple                          229,206             166,675          184,871 -          27.3            10.9
    4.Sweet Corn                           88,010               88,457            90,083              0.5              1.8
    5 Fruit & Vegetable                  347,518             345,406          324,410 -            0.6 -            6.1
    6 Ready to Eat                       332,039             341,789          408,572              2.9            19.5
    Grand total                     1,309,871        1,266,640     1,299,778  -           3.3             2.6


      Value BAHT (mil.)
    1 Tuna                                 32,761               34,326            29,197              4.8 -          14.9

    2 Seafood                               6,274                5,666             5,432 -            9.7 -            4.1
    3 Pineapple                             5,899                6,063             7,089              2.8            16.9

    4. Sweet Corn                           2,582                2,766             2,796              7.1              1.1

    5 Fruit & Vegetable                    16,878               17,428            16,787              3.3 -            3.7
    6 Ready to Eat                         19,271               18,160            17,650 -            5.8 -            2.8
    Grand total                          83,666             84,409          78,952             0.9  -           6.5


       Value USD (mil.)
    1 Tuna                                  1,038                1,099                969              5.9 -          11.9
    2 Seafood                                  199                   182                180 -            8.6 -            0.9
    3 Pineapple                                187                   195                235              4.4            20.6
    4. Sweet Corn                                82                     89                  93              8.4              4.3
    5 Fruit & Vegetable                        535                   559                556              4.5 -            0.4
    6 Ready to Eat                             611                   584                585 -            4.4              0.1
    Grand total                            2,651               2,707            2,618             2.1  -           3.3


    Source : Thailand Ministry of Commerce
    Prepared by Thai Food Processors' Association
    updated : 25 JUNE 2021
   1   2   3   4   5   6   7