
Page 4 - 6. TFPA export to World in January-June
P. 4
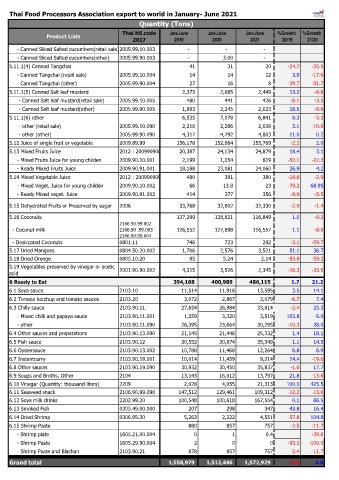
Thai Food Processors Association export to world in January- June 2021
                                                  Quantity (Tons)
                                            Thai HS.code     Jan-June     Jan-June     Jan-June   %Growth   %Growth
                 Product Lists
                                                2017          2019          2020         2021       20/19    21/20
         - Canned Sliced Salted cucumbers(retail sale)2005.99.10.003                   -                   -                   -
         - Canned Sliced Salted cucumbers(other)  2005.99.90.003                   -                  3.00                   -
    5.11.1(4) Canned Tangchai                                                41                     31                     20  -24.7  -35.5
         - Canned Tangchai (retail sale)   2005.99.10.004                     14                     14                     12  3.9  -17.6
         - Canned Tangchai (other)         2005.99.90.004                     27                     16                      8  -39.7  -51.7
    5.11.1(5) Canned Salt leaf mustard                                  2,373                2,685                2,449  13.2  -8.8
          - Canned Salt leaf mustard(retail sale)  2005.99.10.005                   480                   441                   426  -8.1  -3.5
          - Canned Salt leaf mustard(other)  2005.99.90.005                1,893                2,245                2,023  18.5  -9.8
    5.11.1(6) other                                                     6,535                7,078                6,841  8.3  -3.3
          - other (retail sale)            2005.99.10.090                2,218                2,286                2,038  3.1  -10.9
          - other (other)                  2005.99.90.090                4,317                4,792                4,803  11.0  0.2
    5.12 Juice of single fruit or vegetable  2009.89.99              156,178            152,664            155,769  -2.2  2.0
    5.13 Mixed Fruits Juice                2012 : 20099090001            20,387              24,134              24,879  18.4  3.1
         - Mixed Fruits Juice for young childen  2009.90.10.001                2,199                1,054                   819  -52.1  -22.3
         - Ready Mixed Fruits Juice        2009.90.91.001              18,188              23,081              24,060  26.9  4.2
    5.14 Mixed Vegetable Juice             2012 : 20099090002                 480                   391                   380  -18.6  -2.9
         - Mixed Veget. Juice for young childen  2009.90.10.002                     66                  13.8                     23  -79.2  68.95
         - Ready Mixed veget. Juice        2009.90.91.002                   414                   377                   356  -8.9  -5.5
    5.15 Dehydrated Fruits or Preserved by sugar  2006                 33,768              32,802              32,330  -2.9  -1.4

    5.16 Coconuts                                                    127,299            128,621            116,849  1.0  -9.2
                                           2106.90.99.002
      - Coconut milk                       2106.90 .99.003            126,552            127,898            116,557  1.1  -8.9
                                           2106.90.99.004
      - Desiccated Coconuts                0801.11                         746                   723                   292  -3.1  -59.7
    5.17 Dried Mangoes                     0804.50.20.002                1,706                2,576                3,521  51.1  36.7
    5.18 Dried Orenge                      0805.10.20                        85                  5.24                  2.14  -93.8  -59.2
    5.19 Vegetables preserved by vinegar or acetic   2001.90.90.002                4,315                3,526                2,345  -18.3  -33.5
    acid
                                                                                                    #DIV/0!  #DIV/0!
    6 Ready to Eat                                                 394,108          400,989          486,115  1.7  21.2
    6.1 Soya sauce                         2103.10               11,514       11,916       13,595       3.5    14.1
    6.2 Tomato ketchup and tomato sauces   2103.20                3,072        2,867        3,079      -6.7     7.4
    6.3 Chilly sauce                       2103.90.11            27,654       26,984       33,814      -2.4    25.3
         - Mixed chilli and papaya sauce   2103.90.11.001         1,259        3,320        3,519     163.8     6.0
         - other                           2103.90.11.090        26,395       23,664       30,295     -10.3    28.0
    6.4 Other sauces and preparations      2103.90.13.090        21,145       21,446       25,332       1.4    18.1
    6.5 Fish sauce                         2103.90.12            30,552       30,874       35,349       1.1    14.5
    6.6 Oystersauce                        2103.90.13.002        10,788       11,468       12,264       6.8     6.9
    6.7 Instantcurry                       2103.90.19.001        10,014       11,459        9,214      14.4   -19.6
    6.8 Other sauces                       2103.90.19.090        30,932       30,450       35,837      -1.6    17.7
    6.9 Soups and Broths, Other            2104                  13,143       16,012       13,797      21.8   -13.8
    6.10 Vinegar (Quantity: thousand liters)  2209                2,028        4,055       21,313     100.0   425.5
    6.11 Seaweed snack                     2106.90.99.090       147,512      129,461      109,312     -12.2   -15.6
    6.12 Soya milk drinks                  2202.99.20           100,548      100,618      167,554       0.1    66.5
    6.13 Smoked Fish                       0305.49.00.000          207           298          347      43.8    16.4
    6.14 Dried Shrimp                      0306.95.30             5,263        2,222        4,551     -57.8   104.8
    6.15 Shrimp Paste                                              880           857          757      -2.5   -11.7
         - Shrimp plate                    1605.21.00.004            0             1          0.4             -39.6
         - Shrimp Paste                    1605.29.90.004            2             0            0     -93.2  -100.0
         - Shrimp Paste and Blachan        2103.90.21              878           857          757      -2.4   -11.7

    Grand total                                                 1,558,979       1,512,446       1,572,929  -3.0  4.0