Page 3 - 6. TFPA export to World in January-June
P. 3

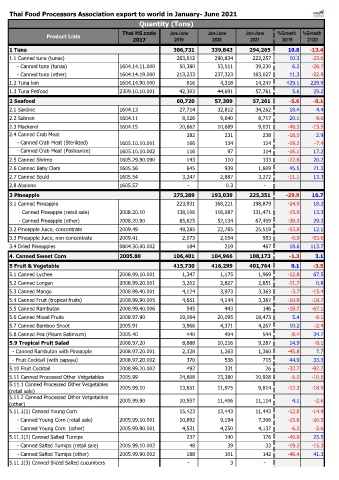
Thai Food Processors Association export to world in January- June 2021
                                                  Quantity (Tons)
                                            Thai HS.code     Jan-June     Jan-June     Jan-June   %Growth   %Growth
                 Product Lists
                                                2017          2019          2020         2021       20/19    21/20
    1 Tuna                                                         306,731          339,843          294,265  10.8  -13.4
    1.1 Canned tuna (tunas)                                          263,612            290,834            222,257  10.3  -23.6
         - Canned tuna (tunas)             1604.14.11.000              50,380              53,511              39,230  6.2  -26.7
         - Canned tuna (other)             1604.14.19.000            213,233            237,323            183,027  11.3  -22.9
    1.2 Tuna loin                          1604.14.90.000                   816                4,318              14,247  429.1  229.9
    1.3 Tuna Petfood                       2309.10.10.001              42,303              44,691              57,761  5.6  29.2
                                                                                                    #DIV/0!  #DIV/0!
    2 Seafood                                                        60,720             57,309             57,261  -5.6  -0.1
    2.1 Sardine                            1604.13                     27,714              32,812              34,262  18.4  4.4
    2.2 Salmon                             1604.11                      8,026                9,640                8,717  20.1  -9.6
    2.3 Mackerel                           1604.15                     20,662              10,689                9,031  -48.3  -15.5
    2.4 Canned Crab Meat                                                   282                   231                   238  -18.0  2.9
         - Canned Crab Meat (Sterilized)   1605.10.10.001                   166                   134                   124  -19.2  -7.4
         - Canned Crab Meat (Pasteurize)   1605.10.10.002                   116                     97                   114  -16.1  17.2
    2.5 Canned Shrimp                      1605.29.90.090                   143                   110                   133  -22.6  20.2
    2.6 Canned Baby Clam                   1605.56                         645                   939                1,609  45.5  71.3
    2.7 Canned Squid                       1605.54                      3,247                2,887                3,272  -11.1  13.3
    2.8 Abalone                            1605.57                          -                    0.3                   -
                                                                                                    #DIV/0!  #DIV/0!
    3 Pineapple                                                    275,289          193,039          225,351  -29.9  16.7
    3.1 Canned Pineapple                                             223,931            168,221            198,879  -24.9  18.2
          - Canned Pineapple (retail sale)  2008.20.10               138,106            116,087            131,471  -15.9  13.3
          - Canned Pineapple (other)       2008.20.90                  85,825              52,134              67,409  -39.3  29.3
    3.2 Pineapple Juice, concentrate       2009.49                     49,285              22,765              25,519  -53.8  12.1
    3.3 Pineapple Juice, non concentrate   2009.41                      2,073                2,054                   953  -0.9  -53.6
    3.4 Dried Pineapples                   0804.30.00.002                   184                   219                   467  18.6  113.7
                                                                       54,739              55,171                   144  0.8  -99.7
    4. Canned Sweet Corn                   2005.80                 106,401          104,966          108,173  -1.3  3.1
                                                                                                  #DIV/0! #####
    5 Fruit & Vegetable                                            415,730          416,299          401,764  0.1  -3.5
    5.1 Canned Lychee                      2008.99.10.001                1,347                1,175                1,969  -12.8  67.5
    5.2 Canned Longan                      2008.99.20.001                3,202                2,827                2,851  -11.7  0.8
    5.3 Canned Mango                       2008.99.40.001                 4,124                3,973                3,363  -3.7  -15.4
    5.4 Canned Fruit (tropical fruits)     2008.99.90.005                4,651                4,144                3,367  -10.9  -18.7
    5.5 Canned Rambutan                    2008.99.40.006                   545                   443                   146  -18.7  -67.1
    5.6 Canned Mixed Fruits                2008.97.90                  19,064              20,095              18,473  5.4  -8.1
    5.7 Canned Bamboo Shoot                2005.91                      3,966                4,371                4,267  10.2  -2.4
    5.8 Canned Pea (Pisum Satinvum)        2005.40                         440                   404                   544  -8.4  34.7
    5.9 Tropical Fruit Salad               2008.97.20                   8,888              10,216                9,287  14.9  -9.1
      - Canned Rambutan with Pineapple     2008.97.20.001                2,328                1,263                1,360  -45.8  7.7
      - Fruit Cocktail (with papaya)       2008.97.20.002                   370                   536                   715  44.9  33.3
    5.10 Fruit Cocktail                    2008.99.20.002                   492                   331                     26  -32.7  -92.2
    5.11 Canned Processed Other Vetgetables  2005.99                   24,608              23,380              20,928  -5.0  -10.5
    5.11.1 Canned Processed Other Vetgetables   2005.99.10              13,651              11,975                9,814  -12.3  -18.0
    (retail sale)
    5.11.2 Canned Processed Other Vetgetables   2005.99.90              10,957              11,406              11,114  4.1  -2.6
    (other)
    5.11.1(1) Canned Young Corn                                        15,423              13,443              11,443  -12.8  -14.9
         - Canned Young Corn (retail sale)  2005.99.10.001              10,892                9,194                7,306  -15.6  -20.5
         - Canned Young Corn  (other)      2005.99.90.001                4,531                4,250                4,137  -6.2  -2.6
    5.11.1(2) Canned Salted Turnips                                        237                   140                   176  -40.9  25.5
         - Canned Salted Turnips (retail sale)  2005.99.10.002                     48                     39                     33  -19.2  -15.3
         - Canned Salted Turnips (other)   2005.99.90.002                   188                   101                   142  -46.4  41.3
    5.11.1(3) Canned Sliced Salted cucumbers                                -                      3                   -
   1   2   3   4   5   6   7   8