Page 2 - 6. TFPA export to World in January-June
P. 2

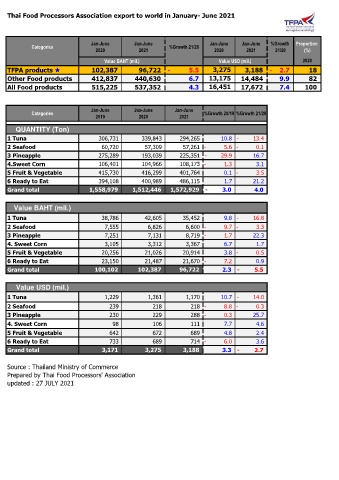
Thai Food Processors Association export to world in January- June 2021


                                 Jan-June       Jan-June                   Jan-June   Jan-June  %Growth   Proportion
            Categories                                      %Growth 21/20
                                   2020           2021                      2020        2021      21/20     (%)
                                      Value BAHT (mil.)                       Value USD (mil.)             2020
    TFPA products                  102,387           96,722  -            5.5       3,275       3,188  -      2.7          18
    Other Food products             412,837        440,630               6.7     13,175     14,484        9.9          82
    All Food products                515,225        537,352              4.3     16,451     17,672        7.4       100


                                 Jan-June       Jan-June      Jan-June
            Categories                                                   %Growth 20/19 %Growth 21/20
                                   2019           2020          2021
       QUANTITY (Ton)
    1 Tuna                               306,731             339,843          294,265            10.8 -          13.4
    2 Seafood                              60,720               57,309            57,261 -            5.6 -            0.1
    3 Pineapple                          275,289             193,039          225,351 -          29.9            16.7
    4.Sweet Corn                         106,401             104,966          108,173 -            1.3              3.1
    5 Fruit & Vegetable                  415,730             416,299          401,764              0.1 -            3.5
    6 Ready to Eat                       394,108             400,989          486,115              1.7            21.2
    Grand total                     1,558,979        1,512,446     1,572,929  -           3.0             4.0


      Value BAHT (mil.)
    1 Tuna                                 38,786               42,605            35,452              9.8 -          16.8

    2 Seafood                               7,555                6,826             6,600 -            9.7 -            3.3
    3 Pineapple                             7,251                7,131             8,719 -            1.7            22.3

    4. Sweet Corn                           3,105                3,312             3,367              6.7              1.7

    5 Fruit & Vegetable                    20,256               21,026            20,914              3.8 -            0.5
    6 Ready to Eat                         23,150               21,487            21,670 -            7.2              0.9
    Grand total                        100,102           102,387          96,722             2.3  -           5.5


       Value USD (mil.)

    1 Tuna                                  1,229                1,361             1,170            10.7 -          14.0
    2 Seafood                                  239                   218                218 -            8.8 -            0.3
    3 Pineapple                                230                   229                288 -            0.3            25.7
    4. Sweet Corn                                98                   106                111              7.7              4.6
    5 Fruit & Vegetable                        642                   672                689              4.8              2.4
    6 Ready to Eat                             733                   689                714 -            6.0              3.6
    Grand total                            3,171               3,275            3,188             3.3  -           2.7


    Source : Thailand Ministry of Commerce
    Prepared by Thai Food Processors' Association
    updated : 27 JULY 2021
   1   2   3   4   5   6   7